
Figure 2. Statistical difference in the classifier-identified discriminative FCs between CUD patients and healthy controls, examined by two-sample t-tests.
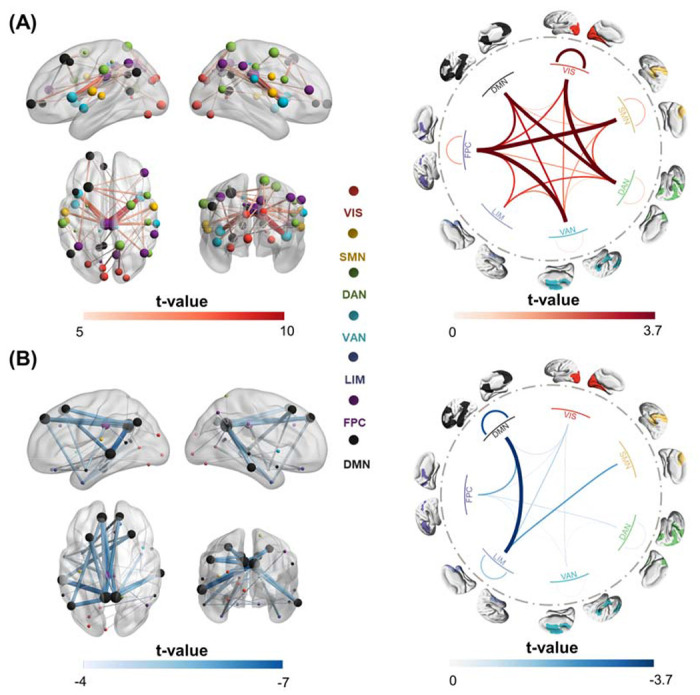
(A) The 40 most significant hyperconnections (CUD > healthy controls), with their t-values shown in the left panel. Node size indicated the node strength calculated from the sum of the linked FC t-value. The right panel shows the average t-values across all significant hyperconnections, calculated at the network level. (B) The 40 most significant hypoconnections (CUD < healthy controls), with their t-values shown in the left panel. Node size indicated the node strength calculated from the sum of the linked FC t-value. The right panel shows the average t-values across all significant hypoconnections, calculated at the network level. Only the FCs that passed the FDR correction (p<0.05) are considered significantly discriminative FCs.