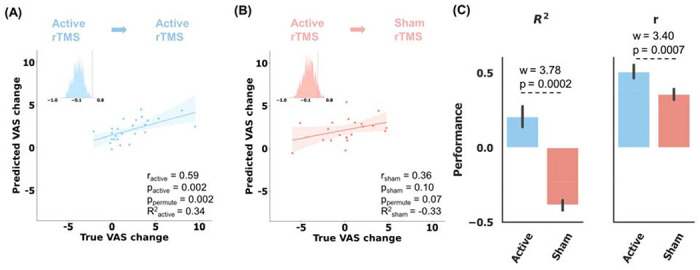
Figure 4. Prediction of the craving visual analog scale (VAS) score changes specific to active rTMS in ten 5-fold cross-validation.

The statistical significance of prediction performance was confirmed by 1000 random permutation tests. (A) Scatter plot showing the prediction results of all patients who were assigned active treatment, using the CUD discriminative FC features (r = 0.59, p = 0.002, ppermute = 0.002). The predicted scores were averaged from the scores predicted from ten 5-fold models. (B) Application of active rTMS-trained models to the sham rTMS failed to predict the clinical score change (r = 0.36, p = 0.10, ppermute = 0.07). (C) Difference in the prediction performance between active and sham rTMS treatment groups. It was evaluated by Wilcoxon signed-rank test of all prediction performance of ten 5-fold models. wR2 = 3.78, pR2 = 0.0002; wr = 3.40, pr = 0.0007.
