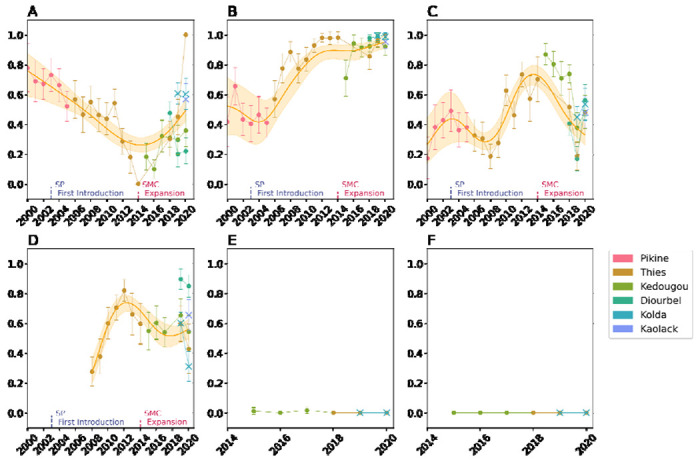
Fig 2. SNP-based Molecular Surveillance Results.

. Frequencies for A) Pfcrt K76T, B) Pfdhfr triple mutant (N51C, C59R, S108N), C) Pfdhps A437G, D) Pfmdr1 N86F184D1246 haplotype (N86Y, Y184F, D1246Y), E) Pfkelch13 A578S, and F) Pfkelch13 C580Y. The scatterplots show the observed frequencies and their 95% binomial confidence interval. Model predictions from a calibrated generalized additive model and the 95% confidence intervals are shown in orange. The model was calibrated with data from Pikine, Thiès, Diourbel, and Kedougou (denoted with circles). The data from Kolda and Kaolack (denoted with X) were not used for model calibration. Model predictions were not generated for the Pfkelch13 mutations due to their complete or near-complete absence in the data.
