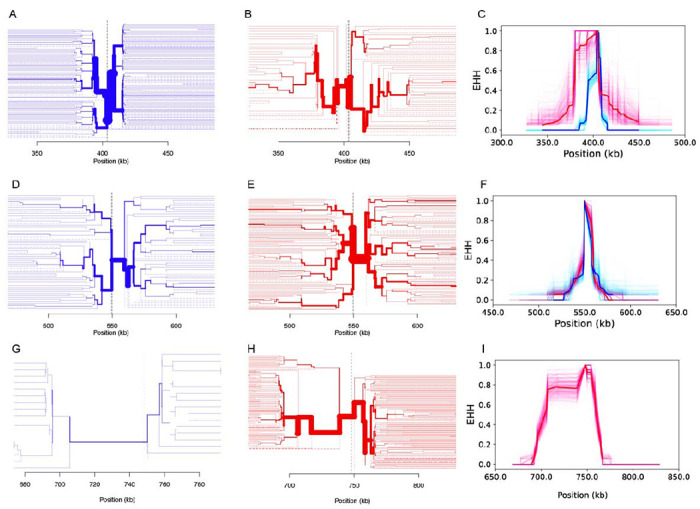
Fig 3. Evidence of selection at Pfcrt, Pfdhps, and Pfdhfr.

Extended haplotype plots for the A-C) Pfcrt K76T locus, D-F) Pfdhps A437G locus, and G) the Pfdhfr triple mutant. Red is used for the resistance allele (Pfcrt K76T, Pfdhps A437G, and Pfdhfr triple mutant) while blue is used for the sensitive allele (Pfcrt K76, Pfdhps A437, Pfdhfr triple sensitive). Column 1 (A, D, G) used samples collected before and after the implementation of SMC. Column 2 (B, E) used samples collected before SMC (before 2014), and Column 3 (C, F) used samples collected after SMC (after 2014). The solid red and blue lines are the EHH estimates obtained from using all available samples in the category. The lighter pink and blue traces are bootstrapped EHH estimates obtained by randomly downsampling fifty samples. For G-I, samples with mixed Pfdhfr genotypes were excluded.
