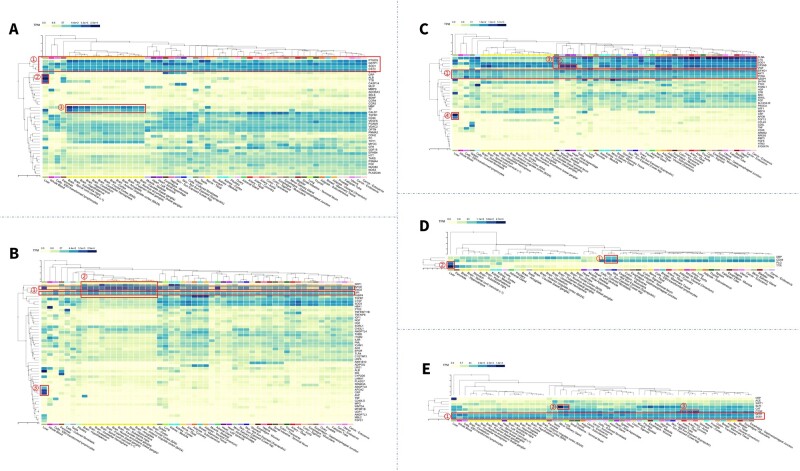
Figure 6.
Biomarker expression in different tissues. (A) For glaucoma: PTGDS, GSTP1, SPD1, and CST3 expressed significantly high in almost all tissues; CRP, ALB, TTR showed markedly increase in liver; MBP and TF had high expression on brain. (B) For DR: GPI and APOE showed high expression in most of tissues; SPP1, APOE, ENO2, and GPI expressed high in the brain; ANGPTL8, APOA2, CRP showed high expression in the liver. (C) For AMD: EIF4G1, AKTI, and PCNA showed high stable expression in most tissues; CYAB showed obvious high expression in the heart and muscle; FLNA, C1S, SOD1, and CRYAB showed increased expression in the brain; CRP, APOB showed high expression in liver. (D) For RE: DBP and CD44 expressed high in the skin; PLG and TTR showed high expression in liver. (E) For cataracts: GPX1 and SOD1 expressed high in most of the tissues; SLP1 significantly expressed high in minor salivary gland and lung; CTGF expressed high in artery.

