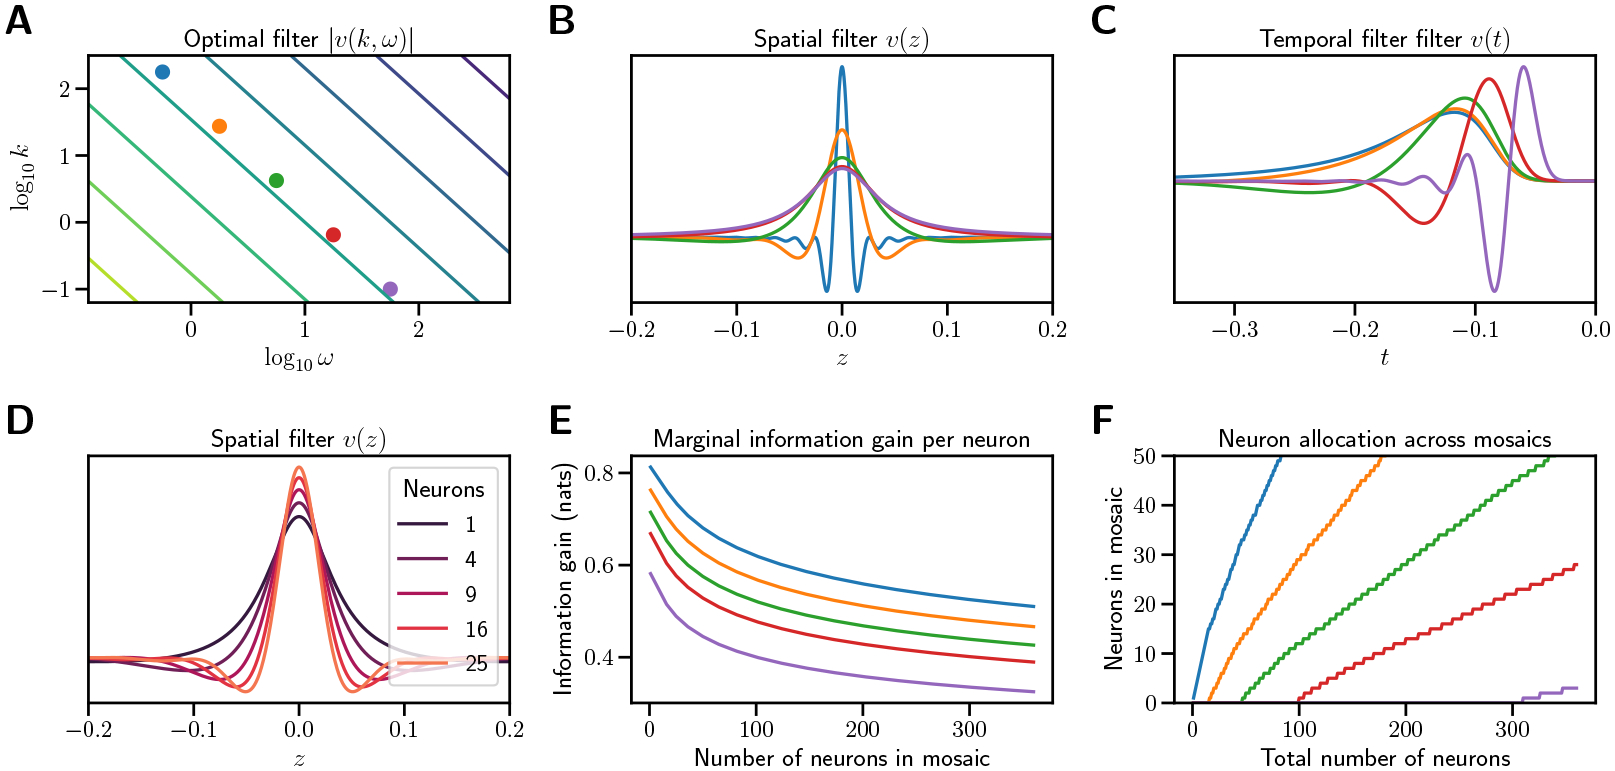
Figure 2:

Optimal filters in the linear spacetime case. (A) Spectrum of the optimal linear spacetime filter in spatial dimension. Contour lines indicate constant (log) power. (B) Spatial filters at representative temporal frequencies. Each filter represents a vertical section at the correspondingly colored dot in A. (C) Temporal filters at representative spatial frequencies. Each filter represents a horizontal section at the correspondingly colored dot in A. (D) Spatial filters at for increasing numbers of RGCs . The spatial extent of the center narrows with more RGCs added to the mosaic. (E) Gain in information per RGC added to each mosaic as a function of current RGC number . New cell types begin when the marginal benefit of adding an RGC to an existing mosaic equals the benefit of adding the first RGC of a new cell type. Color indicates , the temporal frequency of the narrow-band filter. (F) Total number of RGCs in each mosaic as a function of total RGCs across all mosaics. As new cell types arise and form mosaics, new RGCs are allocated to existing mosaics at a decreasing rate. For both plots, , and . Details of calculations in Appendix A.5.
