
Figure 4:
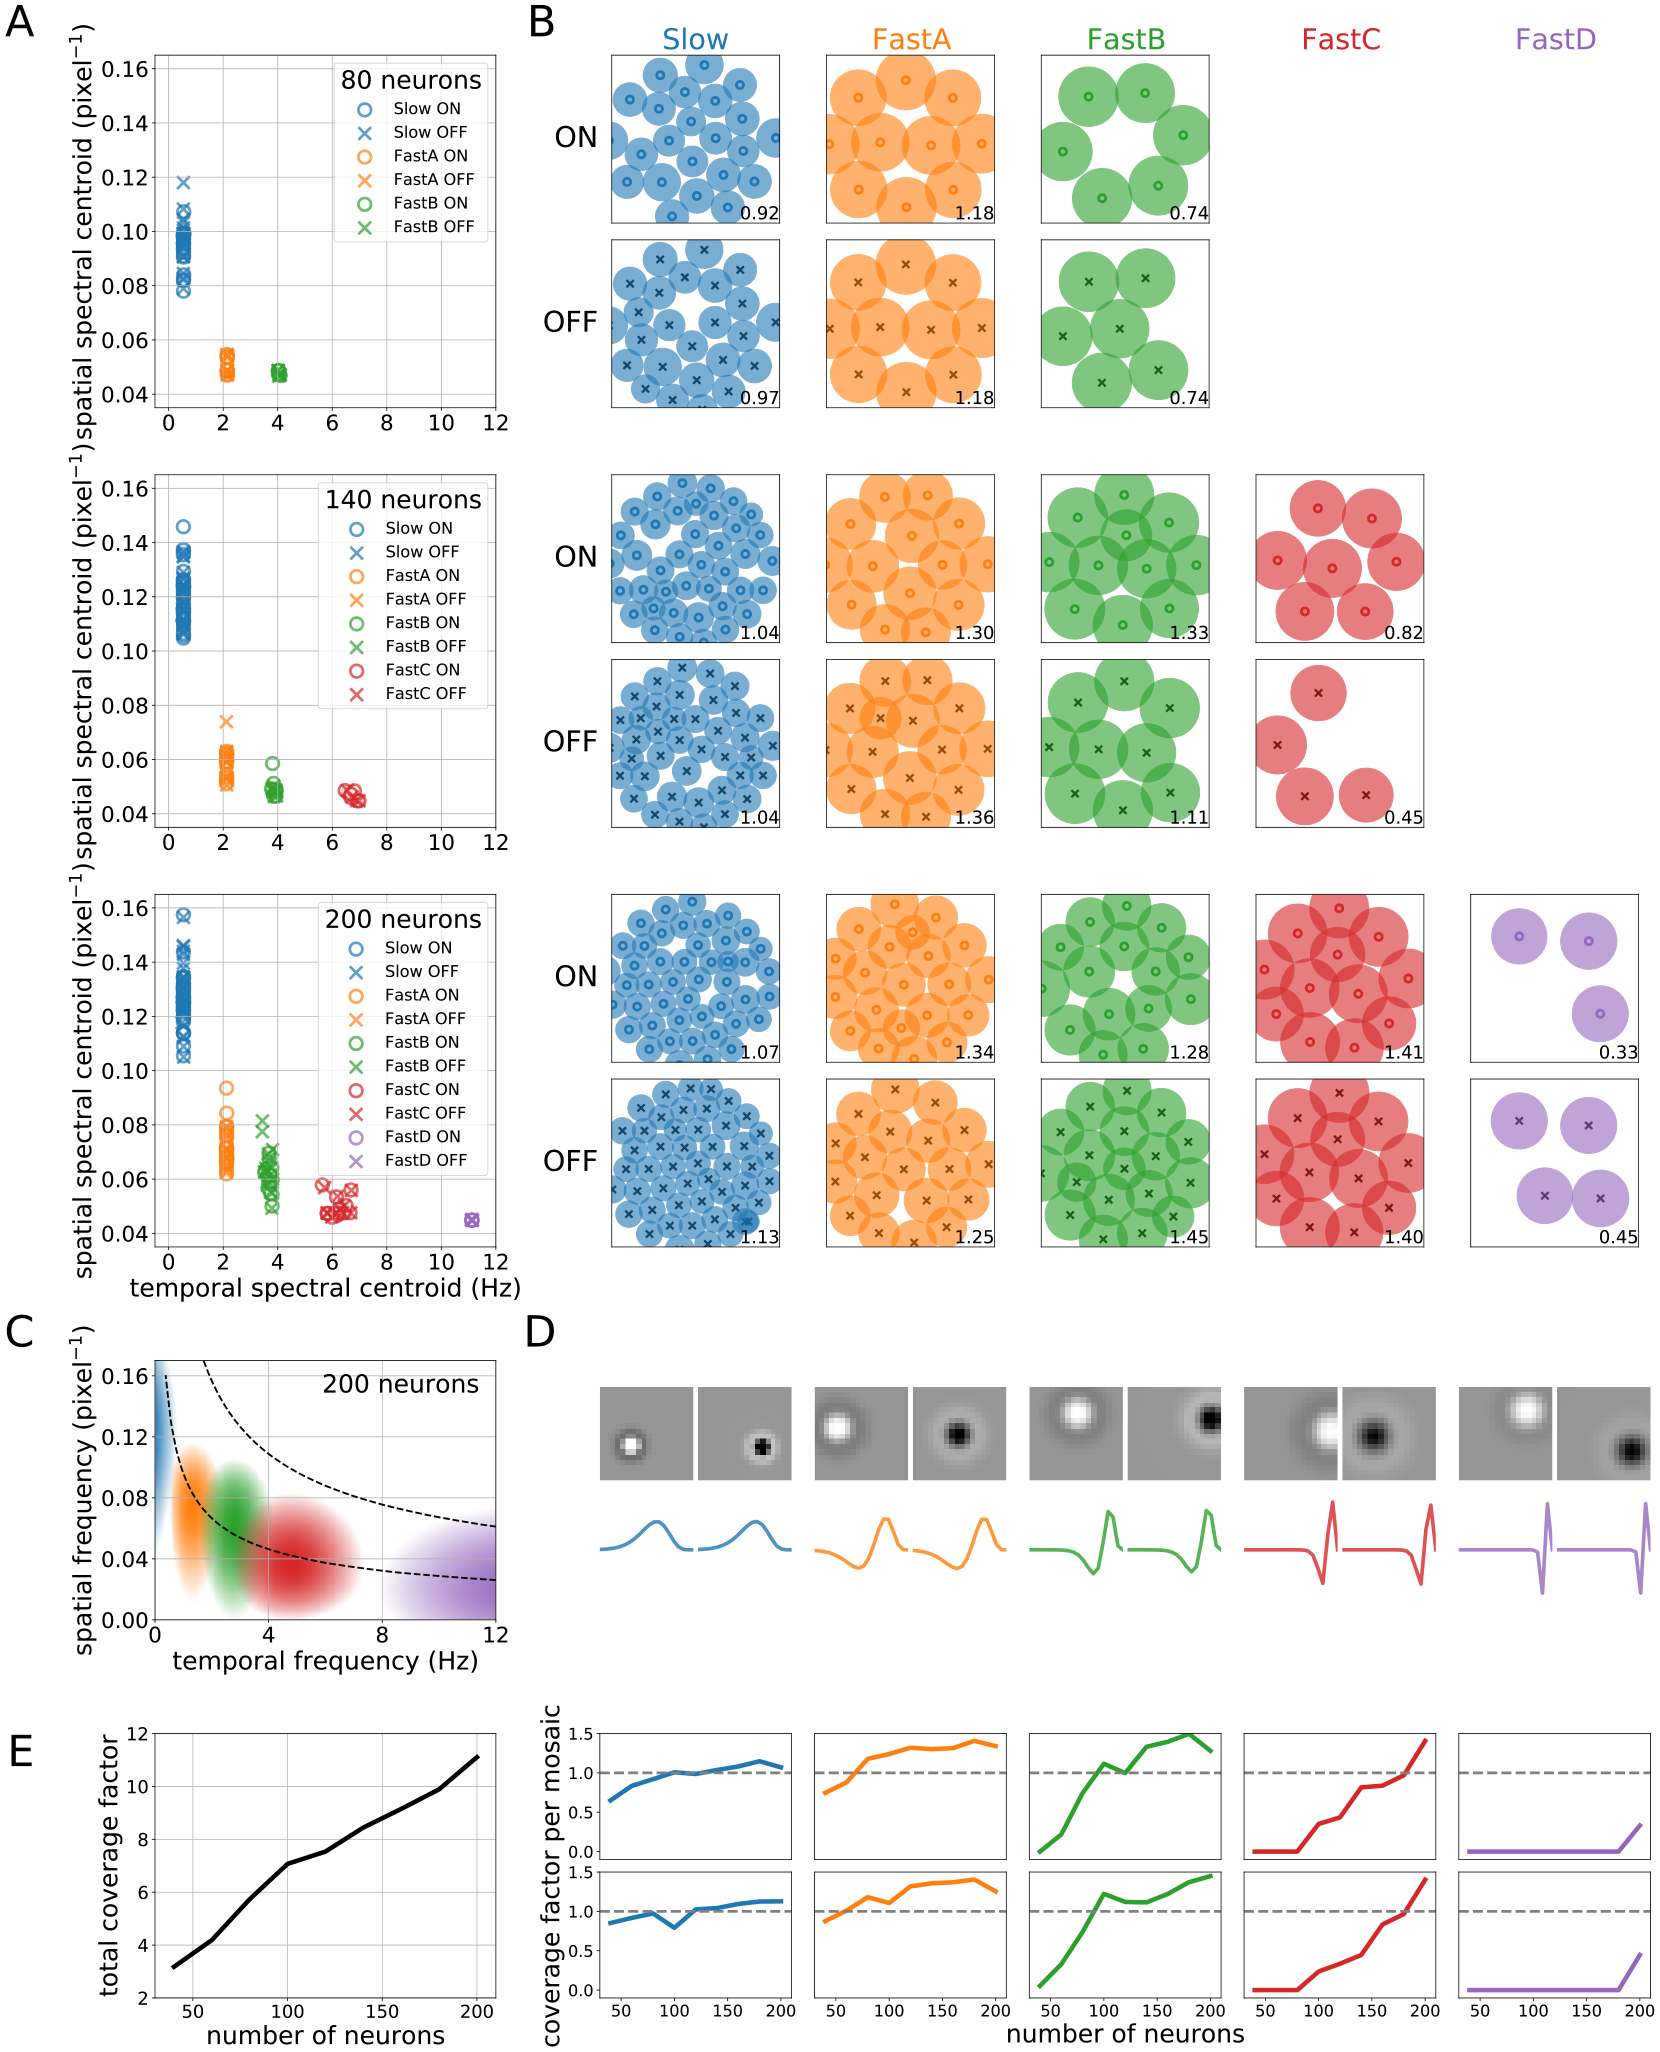
Emergence of new RF types with increasing RGC number. (A) Distribution of spatial and temporal spectral centroids for RGCs. ON and OFF RFs form distinct clusters corresponding to different learned filter types. (B) ON and OFF mosaics corresponding to each cell type. The number in the lower right of each plot is the coverage factor for the mosaic. (C) Power spectral density of a typical kernel in each mosaic for . As predicted, learned kernels filter over roughly nonoverlapping regions of spatiotemporal frequency. Contour lines represent isopower lines of the signal correlation . (D) Learned shapes of example spatial ON and OFF filters (top) and corresponding temporal filters (bottom) from each RF type for the case. (E) Total (left) and per-mosaic (right) coverage factors as the number of RGCs increases from 40 to 200. New mosaics increase coverage linearly with the number of RFs, while nearly full mosaics see diminishing returns in coverage from density increases. See Supplementary Figures 8–9 for similar plots for all RGC numbers.