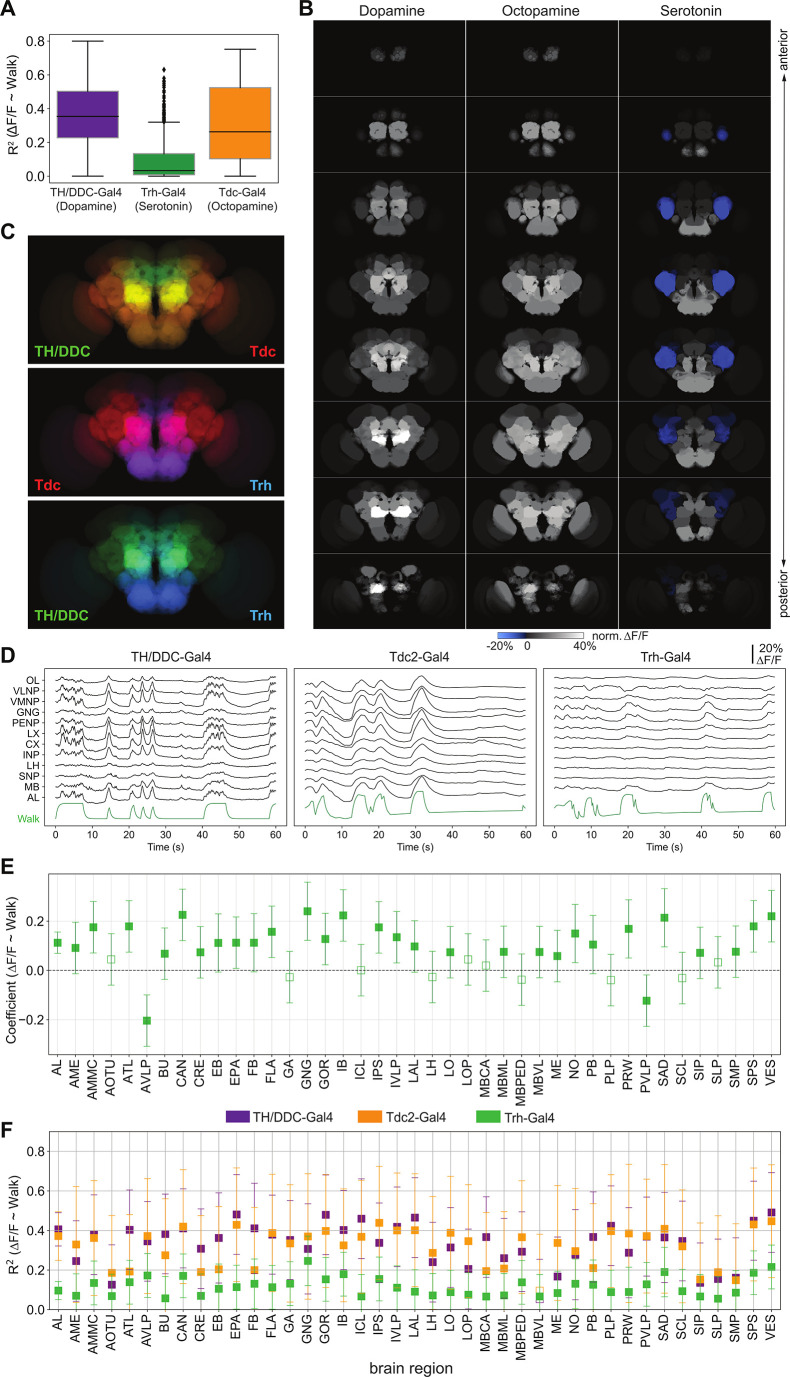
Figure 3. Neuromodulatory neurons are strongly and differentially activated during walk.
TH/DDC-Gal4: N = 9, Tdc2-Gal4: N = 7, Trh-Gal4: N = 6 flies. (A) R2 for regression of single region activity with walk for different genotypes (all regions were pooled). Mann–Whitney U-test Bonferroni adjusted p-values: TH vs. Trh: 0.032, TH vs. TDC: ns, Trh vs. TDC: 0.040. Box plot: center line, median; box limits, upper and lower quartiles; whiskers, ×1.5 interquartile range; points, outliers. (B) Maps of activation during walk (regression coefficient of single region activity with walk) for TH-Gal4 and DDC-Gal4 or GMR58E04-Gal4 (dopaminergic neurons), TDC2-Gal4 (octopaminergic neurons), and Trh-Gal4 (serotonergic neurons) expressing neurons. Blue indicates inhibition. (C) Overlay of activity maps of two neuromodulators in each panel. Cosine similarity: TH vs. Trh: 0.69, TH vs. TDC: 0.93, TDC vs. Trh: 0.69. (D) Sample traces (ΔF/F) for different brain regions relative to forward walk (green). (E) Coefficient during walk for different brain regions for Trh-Gal4 expressing serotonergic neurons. All regions are significantly correlated. (F) R2 of regression of fluorescence vs. walk for TH/DDC(58E02)-Gal4, Tdc2-Gal4, and Trh-Gal4 expressing neurons. Bars are 95% CI.


