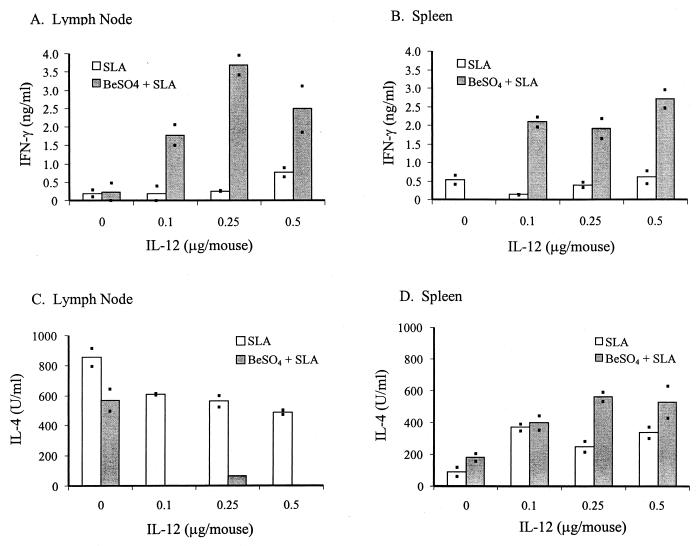
FIG. 2.
Priming with BeSO4 and different concentrations of IL-12 on IFN-γ production in LN and SPL cells upon in vitro restimulation with SLA. Eight groups of mice (three mice per group) were immunized (groups i to viii as described in Materials and Methods). LN and SPL cells from these mice were prepared, and cytokine productions were analyzed as described for Fig. 1. Each bar represents the amount IFN-γ (A and B) or IL-4 (C and D) secreted by SLA-restimulated LN (A and C) or SPL (B and D) cells of a mouse group. Open bars represent cytokines produced by cells from mice immunized with SLA and IL-12; shaded bars represent cytokines produced by cells from mice immunized with SLA, IL-12, plus BeSO4. Cytokine production was measured in duplicate (represented by the points) by ELISA, and the results were averaged as illustrated by the histograms.

