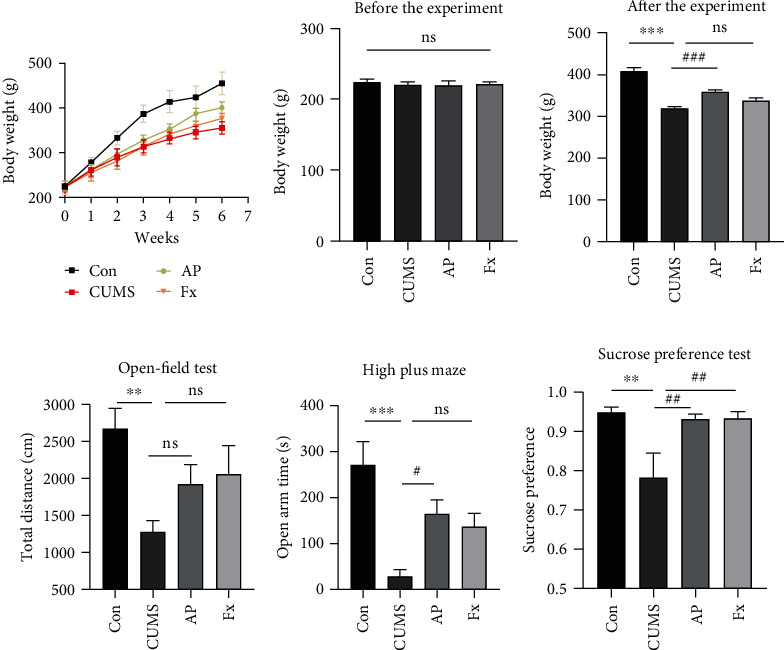
Figure 2.

Body weight changes in all groups. (a) Comparison of rat's body weight growth trend among four groups during the whole experiment. (b) Body weight baseline before the experiment. (c) Body weight changes at the end of the experiment. Behavior changes in all groups. (d) Total distance in the open-field test among four groups. (e) Time in open arms of the elevated plus maze among four groups. (f) The percentage of sucrose consumed by the rat at sucrose concentrations of 1%. Compared with the control group, ∗P < 0.05, ∗∗P < 0.01, and ∗∗∗P < 0.001; compared with the CUMS group, #P < 0.05, ##P < 0.01, and ###P < 0.001. Data represent means ± SEM (n = 8).
