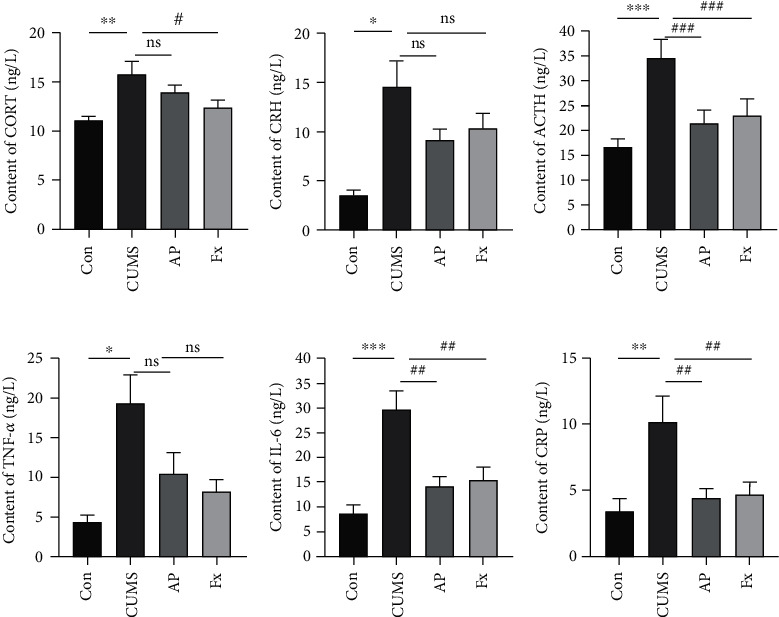
Figure 3.

Expression of the Inflammatory factors. (a) CORT expression in serum. (b) CRH expression in serum. (c) ACTH expression in serum. (d) TNF-α expression in the prefrontal cortex. (e) IL-6 expression in the prefrontal cortex. (f) CRP expression in serum. Compared with the control group, ∗P < 0.05, ∗∗P < 0.01, and ∗∗∗P < 0.001; compared with the CUMS group, #P < 0.05, ##P < 0.01, and ###P < 0.001. Data represent means ± SEM (n = 6).
