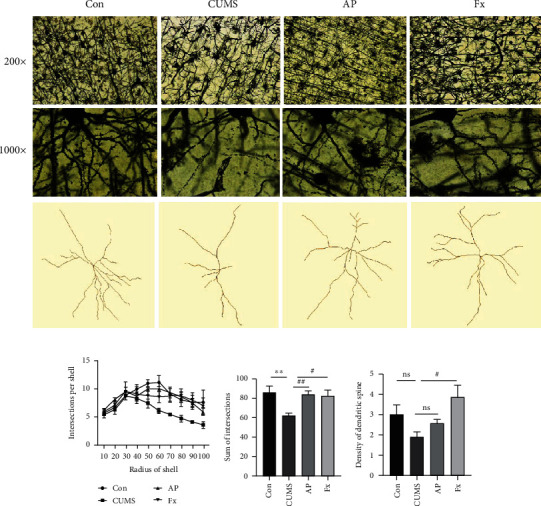
Figure 4.

(a) Golgi staining of rats' prefrontal cortex (200x (up column) and 1000x (down column)). Morphological analyses of dendritic arborization and spine density of prefrontal cortex. (b) Intersection per shell of pyramidal neuron arborization. (c) Sum of intersections of dendrites. (d) Density of dendritic spines. Compared with the control group, ∗P < 0.05, ∗∗P < 0.01, and ∗∗∗P < 0.001; compared with the CUMS group, #P < 0.05, ##P < 0.01, and ###P < 0.001. Data represent means ± SEM (n = 3).
