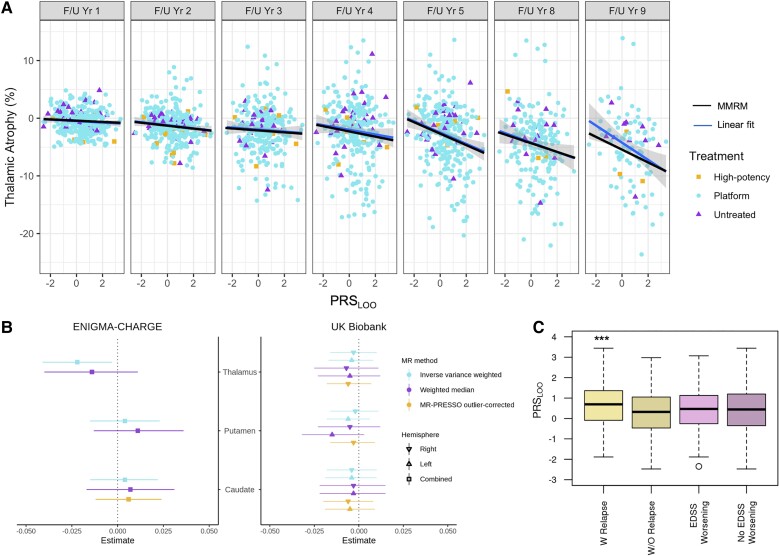
Figure 4.
Genetic risk association with clinical and radiographic phenotypes. (A) Thalamic atrophy at each visit against PRSLOO in the 10-year follow-up period. The blue line is a fit through the raw data at each visit and the shading shows the CI. The black line is the MMRM predictions including measurements from all visits. Different shapes for data-points are used to mark treatment. (B) The forest plot shows Mendelian randomization estimates (standard deviation change in imaging phenotype per doubling in odds of multiple sclerosis) in ENIGMA-CHARGE and UKBB and 95%CI. Inverse variance weighted Mendelian randomization analysis shows a weak effect of multiple sclerosis susceptibility on thalamic volume only in the ENIGMA-CHARGE cohort (P = 0.02). (C) Association of PRSLOO with disease activity represented by presence of relapses is significant (***P = 0.0002; W Relapse, mean = 0.651, IQR = 1.450, min = −1.886, max = 3.442; W/O Relapse, mean = 0.278, IQR = 1.519, min = −2.474, max = 2.978), but not with EDSS worsening (EDSS Worsening, mean = 0.429, IQR = 1.360, min = −2.348, max = 3.069; No EDSS Worsening, mean = 0.410, IQR = 1.545, min = −2.474, max = 3.442) from baseline to Year 5. EDSS = Expanded Disability Status Scale; IQR = interquartile range; min = minimum; max = maximum; PRESSO = Pleiotropy RESidual Sum and Outlier.

