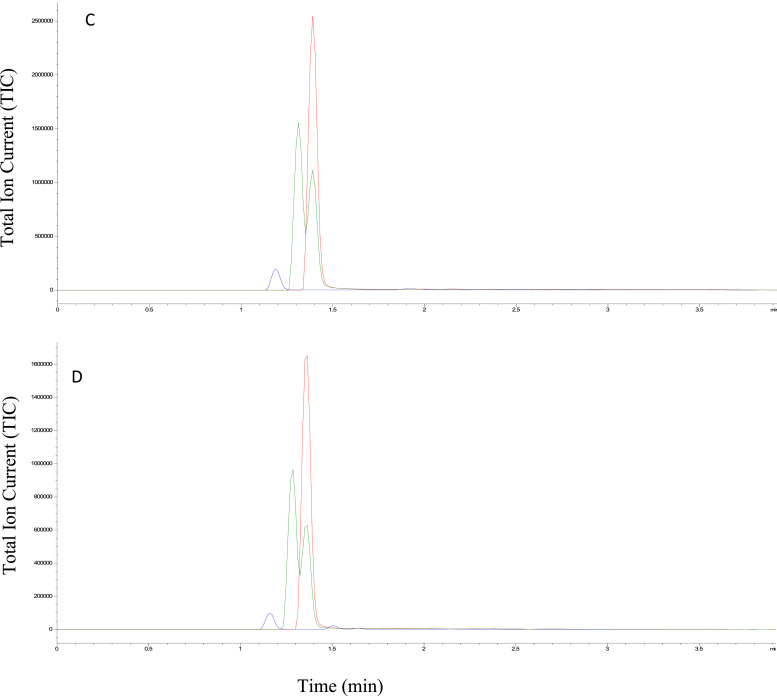
Fig. 2.
Typical chromatogram of PC solution and its degradation products (A) in a freshly made solution, (B) after 3 h of HCl 0.1 M exposure, (C) after 1 hour of NaOH 0.1 M exposure and (D) after 96 h at 80 °C. The PC is quantified at m/z = 286.2, Rt = 1.40 min (red chromatogram). The 3-dPC and 17-dPC are quantified at m/z = 265.2, Rt = 1.35 and 1.45 respectively (green chromatogram). Finally, the 3,17-ddPC is quantified at m/z = 244.2, Rt = 1.15 mn (blue chromatogram).


