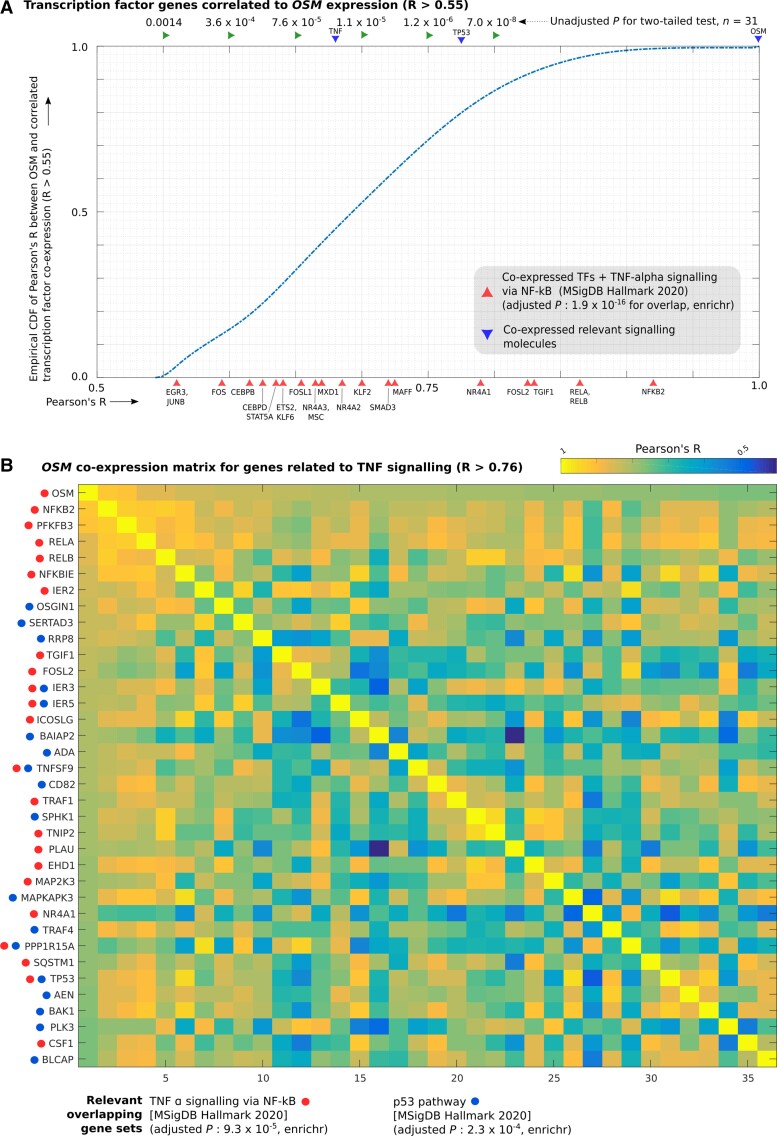
Figure 4.
OSM coexpression module. Coexpression of individual genes with OSM in male samples was quantified using Pearson’s correlation (Pearson’s R). (A) Empirical cumulative distribution function (CDF) of Pearson’s R (with OSM expression) for transcription factor genes with Pearson’s R > 0.55, overlaid with Pearson’s R for genes of key signalling molecules in the TNF-alpha pathway (TNF, TP53 and OSM) and IL32 (another pro-inflammatory cytokine) and members of enriched gene sets that overlap with the coexpressed TF genes are also shown. (B) Heatmap of correlation matrix (Pearson’s R) between members of OSM coexpression module in enriched gene sets (TNF signalling via NFKB, p53 signalling) that overlap with it. Rows and columns of the correlation matrix have the same genes, with the diagonal showing perfect correlation (R = 1).

