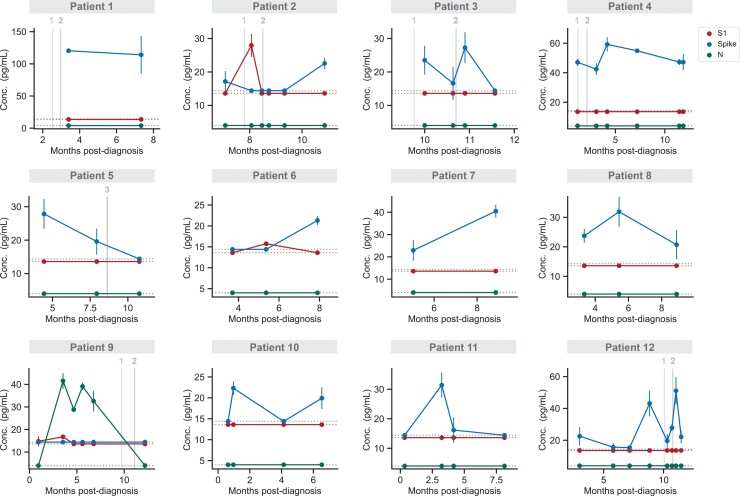
Figure 2.
Temporal profiling of SARS-CoV-2 antigens for individual PASC patients. S1, spike, and N levels versus time for 12 patients diagnosed with PASC. Data points represent mean values ± SD (n = 2). Vertical lines correspond to the times when each patient received either the first, second, or third dose of a COVID-19 vaccine. If an individual was not vaccinated within 1 month of the time frame shown, no vaccination information is shown. Dashed horizontal lines indicate the LOD for each assay. Abbreviations: COVID-19, coronavirus disease; LOD, limit of detection; PASC, postacute sequelae of coronavirus disease 2019; SARS-CoV-2, severe acute respiratory syndrome coronavirus 2.

