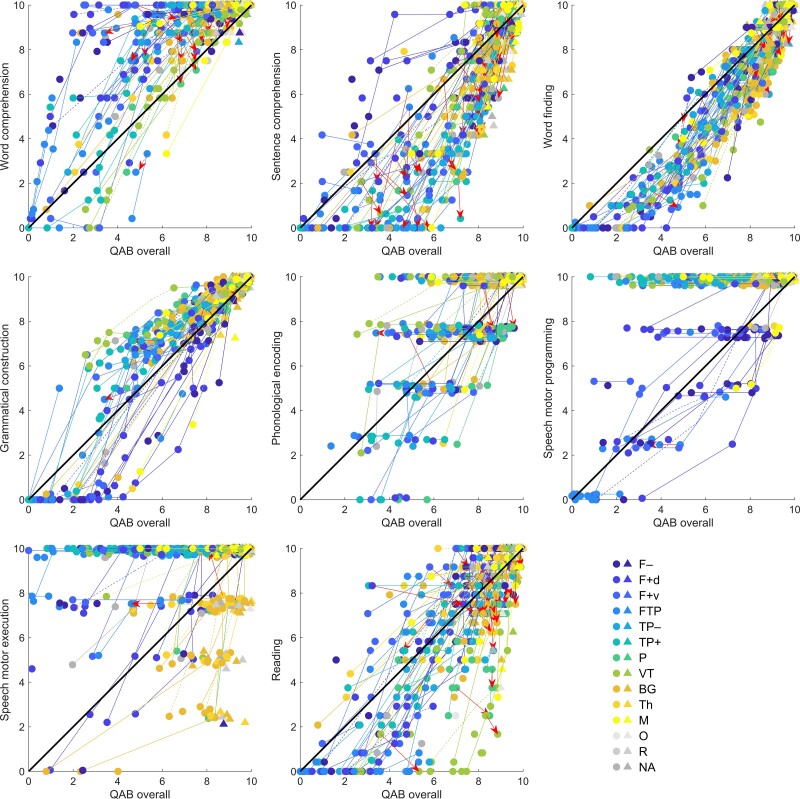
Figure 5.
Comparisons between speech/language domains. Trajectories in spaces defined by each speech/language domain in relation to overall language function. Circles indicate patients with acute aphasia and triangles indicate patients without acute aphasia. Solid lines are plotted between temporally adjacent observations, and dotted lines between observations where intervening data were imputed. Most changes were positive; changes where either the QAB overall score or the relevant subscore declined by more than 0.5 points are plotted in red with arrowheads showing the direction of change. To enhance readability, scores are randomly slightly jittered for phonological encoding, speech motor programming, and speech motor execution, since these measures were scored on 5-point scales.

