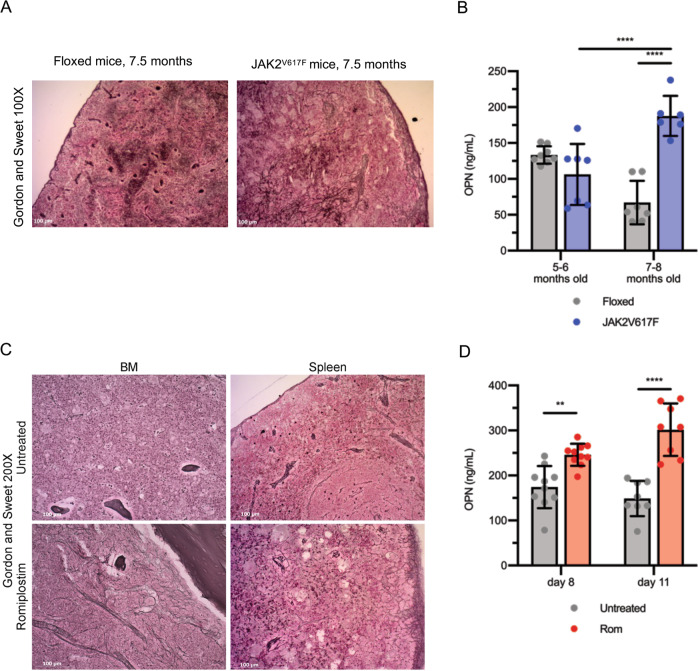
Fig. 2. Plasma OPN is increased in MF mouse models.
A Representative images of Gordon and Sweet’s reticulin staining of spleen sections from JAK2V617F/+ mice and control JAK2floxed/+ animals 7.5 months after birth. Magnification 100×. B OPN plasma levels were evaluated by means of ELISA (enzyme-linked immunosorbent assay) in JAK2V617F/+ and JAK2floxed/+ mice at 5-6 months and 7–8 months after birth. (n = 6–8/group). C BM and spleen fibrosis detection by Gordon and Sweet’s reticulin staining in mice treated with thrombopoietin mimetic Romiplostim (Rom) and control animals (Untreated). Magnification 200×. D Protein levels of OPN were assessed by means of ELISA in plasma from mice treated with Romiplostim or in control animals 8 and 11 days after the first administration (n = 8–10/group). Histograms represent mean values while bars indicate the standard deviation. Comparisons were performed by means of one-way ANOVA. *: P ≤ 0.05; **: P ≤ 0.01; ***: P ≤ 0.001; ****: P ≤ 0.0001 Abbreviations: OPN osteopontin; Rom romiplostim; BM bone marrow.

