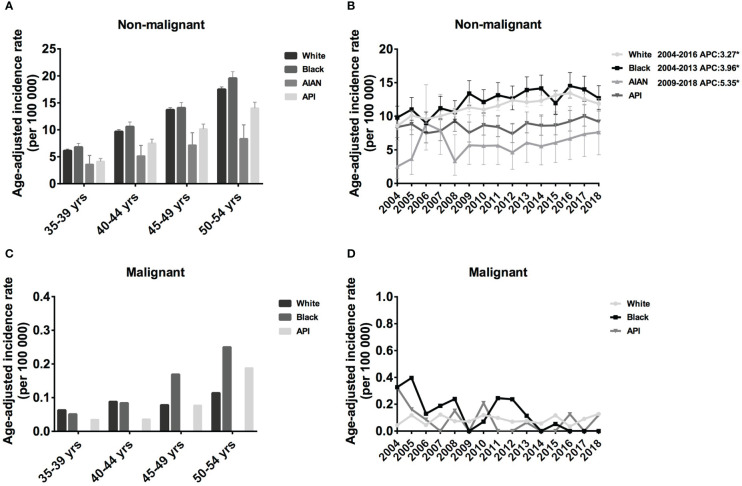
Figure 2.
Age-adjusted incidence rates (IRs) and annual percent changes (APCs) by age and race. IRs by race and by 5-year age intervals (A, C), APCs by race over time from 2004–2018 (B, D). (A, B), non-malignant meningioma; (C, D), malignant meningioma. *Only show APCs that are significantly different at the P < 0.05 level.

