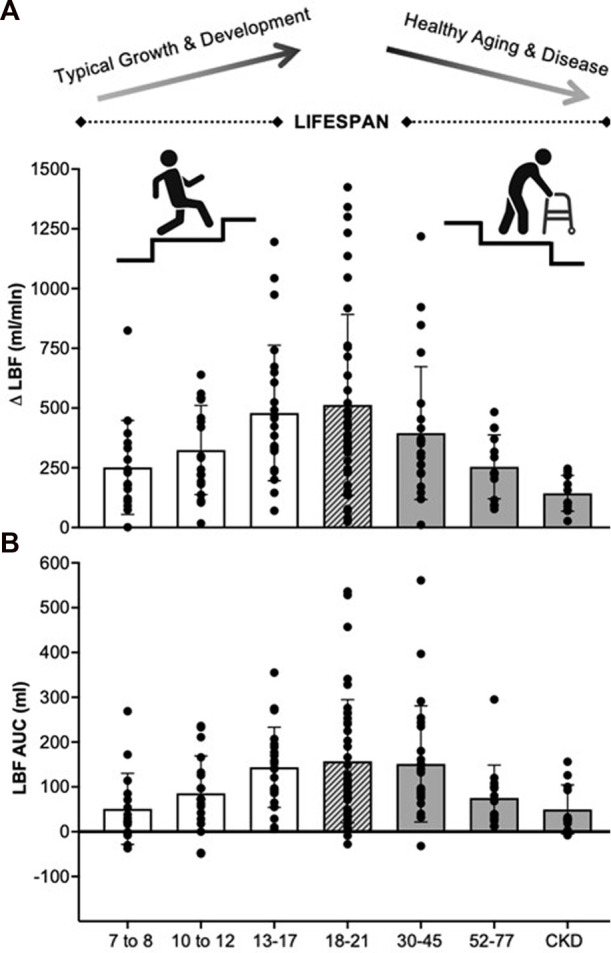
FIGURE 1.

Absolute change in leg blood flow (A) and leg blood flow area under the curve (B) responses to PLM for various age and health status groups recently collected in our laboratory. 7–8 years (n = 16, M/F: 9/7), 10–12 years (n = 19, M/F: 11/8), 13–17 years (n = 24, M/F: 12/12), 18–21 years (n = 40, M/F: 14/26), 30–45 years (n = 24, M/F: 8/16), 52–77 years (n = 14, M/F: 5/9), CKD (n = 12, M/F: 7/5). For illustrative purposes only. LBF, leg blood flow; Δ, absolute change; AUC, area under the curve, CKD, chronic kidney disease.
