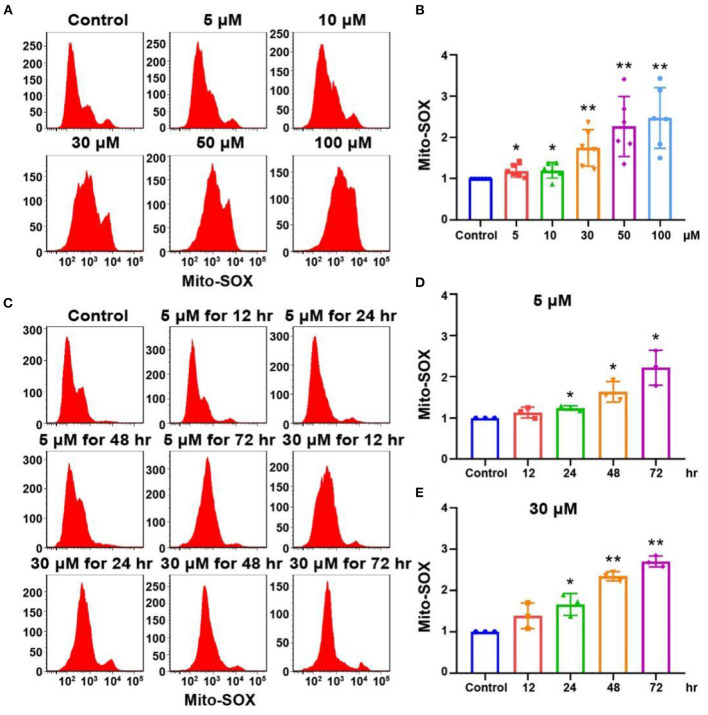
Figure 3.
Mito-SOX flow cytometry of OC-1 cells treated with different cisplatin concentrations and times. (A) ROS levels in cells treated with different cisplatin concentrations for 24 h. (B) Quantification of the data in A. (C) ROS levels in cells treated with 5 or 30 μM cisplatin for different times. (D) Quantification of the data in (C). (E) Quantification of the data in (C). *p < 0.05, **p < 0.01.

