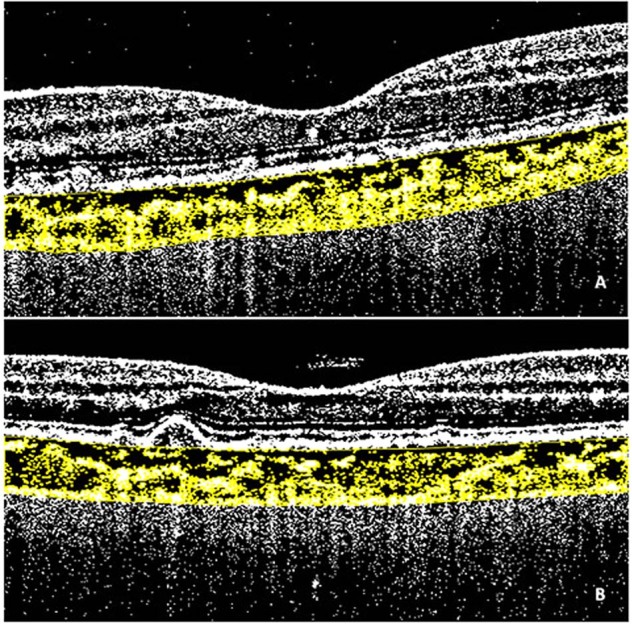
Fig. 2. Spectral domain optical coherence tomography (SDOCT) and choroidal vascularity index (CVI) calculation.

Horizontal SDOCT grid scan (3mm-area centred on the fovea) showing subretinal drusenoid deposits (A) and conventional drusen (B). Binarization of images performed with Image J software according to Niblack’s method. The region of interest corresponds to the yellow area, the totality of yellow dots corresponds to the stromal area while the black dots correspond to the luminal area. The ratio between the luminal area and the stromal area corresponds to the CVI.
