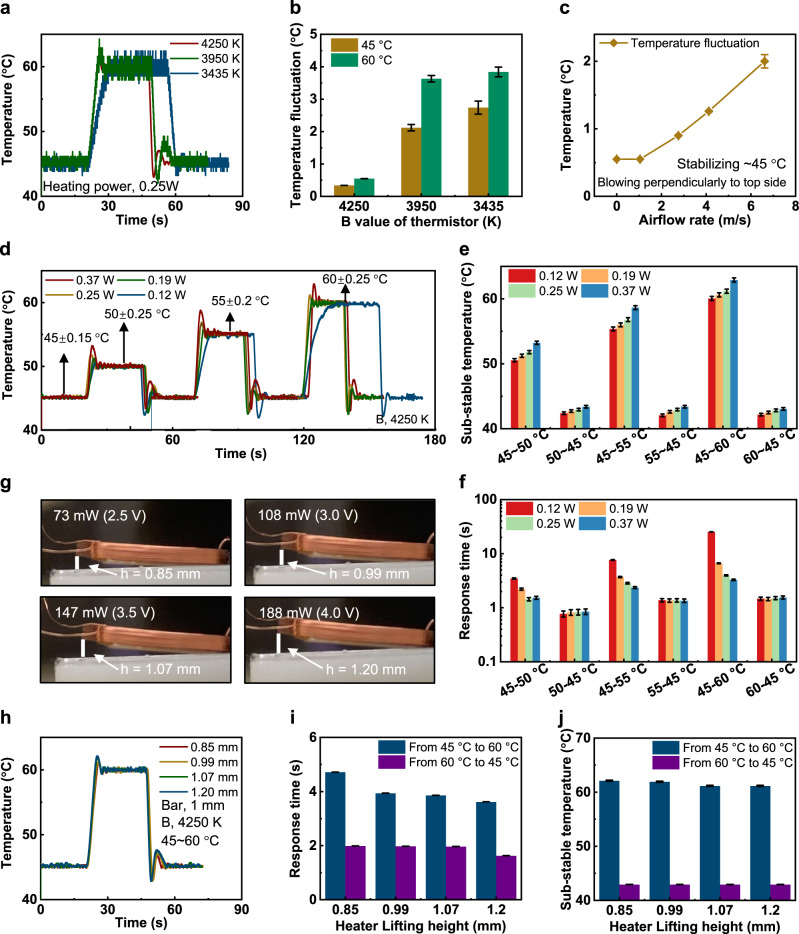
Fig. 2. Optimized operation of the OG.
a, b Electrical response of the OG as a function of B values of thermistors at a constant heating power of 0.25 W as the heating temperature is switched between 45 °C and 60 °C, and the corresponding analyzed result (b). c Temperature fluctuation of the OG as a function of air flow rate at a target-controlled temperature of 45 °C. d–f Electrical response of the OG as a function of heating power ranging from 0.12 W to 0.37 W as the heating temperature is switched between 45 °C and 50 °C, 55 °C, and 60 °C, respectively, with the analyzed results displaying sub-stable temperature (e) and response time (f). g–j Optimization of the power input to the electromagnet Cu coil of the OG with the optical images (g) and corresponding electrical response of the heating temperature (h) with the analyzed results showing the response time (i) and sub-stable temperature (j). In this figure, all the error bars denote the standard deviation.

