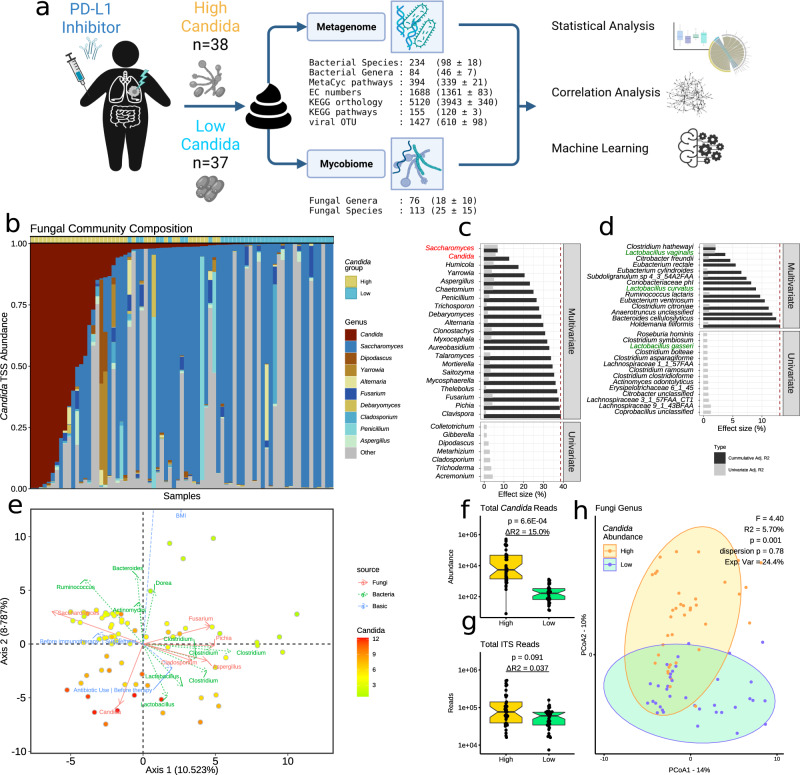
Fig. 1. Explanatory factors of mycobiome diversity.
a Study design. Indicated are the total number of taxonomic and functional features annotated in our study and, in parentheses, their average per sample. Created with BioRender.com. b Fungal genus relative abundance profile (by total-sum scaling, TSS). The top 10 genera by highest median abundance are indicated by colour, with grey indicating the abundance of the remaining fungi. c, d Distance-based redundancy analysis (dbRDA) of fungal species beta diversity (Aitchison distance). Explanatory factors are c fungal genera and d bacterial species’ relative abundance. Only significant terms are shown (raw P < 0.05; PERMANOVA). Displayed are cumulative explained variances of full, non-redundant models (black) and single-term statistics (grey). Important fungal and bacterial taxa are coloured red or green, respectively. e Principal coordinate analysis (PCoA) biplot of fungal species beta diversity (Aitchison). Axes show explained variance. Samples are coloured by Candida centre log ratio-normalised abundance. The top features by ordination correlation (raw P < 0.05; envfit) are bacterial (green), fungal (red), and patient characteristic (blue) arrows indicating the direction of covariance between feature abundances and the first two ordination axes. Samples are in a gradient from high (red) to low (green) Candida abundance. f, g Boxplots showing f the total number of Candida internal transcribed spacer (ITS) reads and g the total number of ITS reads per patient (n = 75). Centre lines denote median values, boxes contain the Q1 and Q3 quartiles (IQR), whiskers extend up to 1.5 × IQR. Values beyond these bounds are considered outliers. Significance was assessed using non-parametric generalized linear models (Rfit drop-test) controlled for body mass index and sex. ΔR2 is the variance explained by differences in Candida grouping. h PCoA of fungal genera beta diversity. Candida grouping (High vs. Low) shows significant separation (P = 0.001; PERMANOVA). Circles indicate the 95% confidence interval of within-group diversity.

