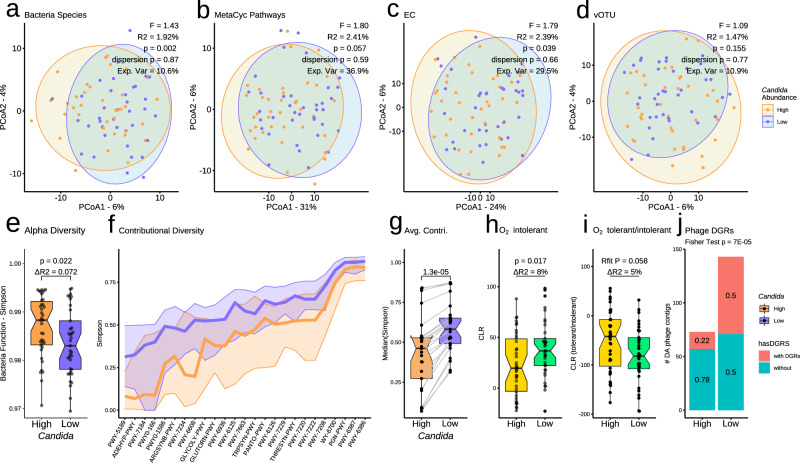
Fig. 2. Microbiome contribution to high and low Candida groups.
a–d Principal coordinate analysis (PCoA) of beta diversity (Aitchison distance) using a bacterial species, b bacterial metabolic pathways, c bacterial enzyme functions (EC, Enzyme Commission) or d viral orthologous taxonomic unit (vOTU) abundance profiles. Bacterial function profiles were stratified for bacteria-only abundances. a, c Diversity was significantly different between Candida groups (High vs. Low; P < 0.05; PERMANOVA; betadisper P > 0.05). e Boxplots of bacterial function (MetaCyc pathway) alpha diversity (Simpson). f MetaCyc pathways with significant contributional Simpson diversity (Rfit drop-test; raw P < 0.05). Centre lines indicate the median Simpson diversity (y-axis) of a pathway (x-axis). Ribbons indicate the 25 and 75% quantiles. Colours indicate High or Low Candida group. g Boxplots of the median contributional diversity per pathway (P = 1e-5; two-sided paired Wilcoxon test; n = 25). For each pathway (point), grey lines indicate change in diversity from High to Low group. h, i Boxplots summarizing the abundance of bacterial taxa stratified by tolerance to molecular oxygen. Only strict and obligate anaerobes were considered anaerobes. e, g–i In boxplots, centre lines denote the median value, boxes contain the Q1 and Q3 quartiles (IQR). The whiskers extend up to 1.5 × IQR, and values beyond these bounds are considered outliers. e, h, i Significance was assessed using non-parametric generalised linear models (Rfit drop-test) controlled for body mass index and sex. ΔR2 is the variance explained by differences in Candida grouping. j Number of phages contigs with (blue) or without (red) diversity-generating retro-elements (DGRs). DGRs were significantly enriched in samples of the low Candida group (P < 0.05; two-sided Fisher test).

