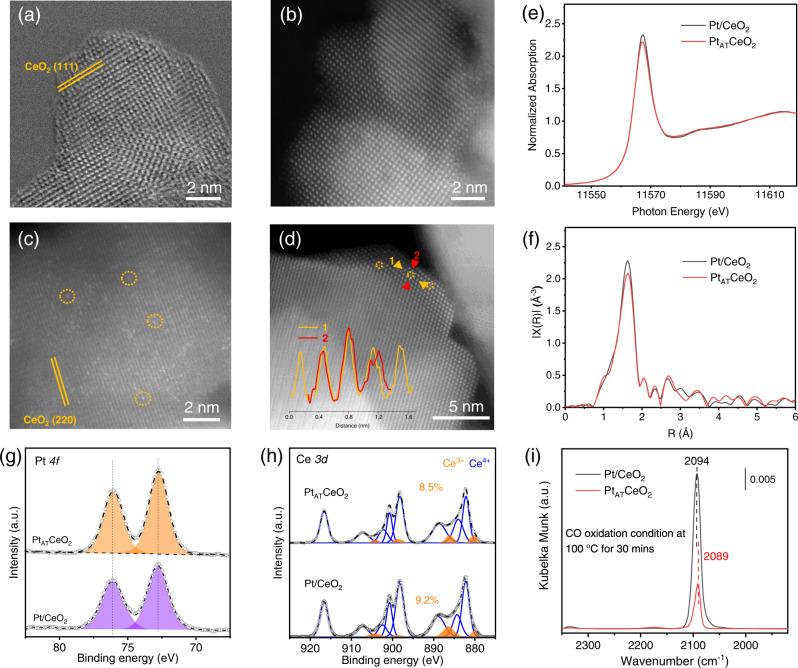
Fig. 2. Ex situ characterizations.
HAADF-STEM images of a, b Pt/CeO2 and c, d PtATCeO2 (Pt1 is marked as cycles, and line-scanning of a single Pt1 is shown in the inset of (d). e Pt L3-edge XANES and f the corresponding magnitude of the Fourier transform of the EXAFS spectra of Pt/CeO2 and PtATCeO2. g, h Pt 4f and Ce 3d XPS spectra of Pt/CeO2 and PtATCeO2. i In situ CO diffuse-reflectance infrared Fourier transform spectra (CO-DRIFTS) for Pt/CeO2 and PtATCeO2 under CO oxidation condition at 100 °C for 30 min.

