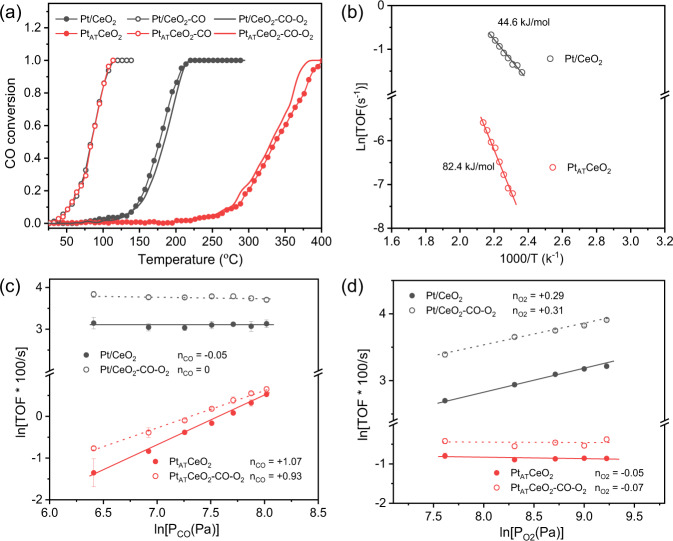
Fig. 3. Catalytic evaluation.
a CO oxidation performance (light-off curve) with 20 mg catalyst, and b Arrhenius plots of Pt/CeO2 and PtATCeO2 with different catalyst loadings (4 mg Pt/CeO2, 300 mg PtATCeO2). Reaction conditions: 1% CO and 4% O2 balanced with Ar, catalyst diluted with SiC to 400 mg, total flow rate = 100 mL/min. Effect of c CO and d O2 partial pressure on the reaction rate (TOF). Measurement conditions: PCO = 0.6–3 kPa, PO2 = 4 kPa in (c); PCO = 1 kPa, PO2 = 2–10 kPa in (d). The operating temperatures for Pt/CeO2, PtATCeO2, Pt/CeO2-CO-O2, and PtATCeO2-CO-O2 are 210, 210, 220, and 215 °C, respectively, in (c, d).

