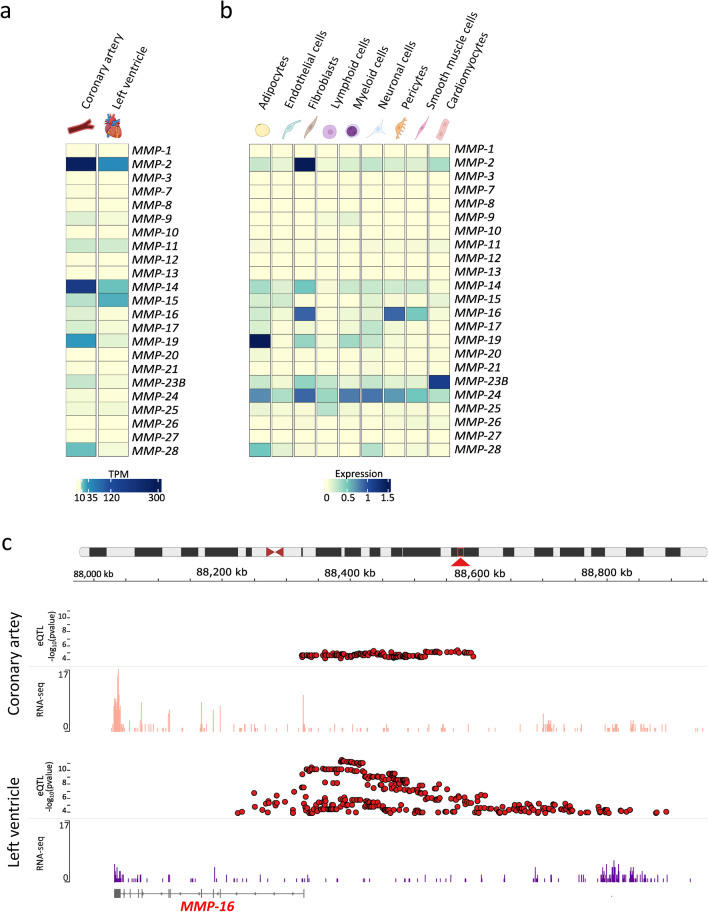
Fig. 2.
Gene expression of MMPs in human tissue. (a) Tissue-specific gene expression data as transcripts per million (TPM) from the GTEx project are plotted as heat map [39]. The expression of all human MMPs is compared between coronary artery and left ventricle. Since presumably non-diseased tissue-sites were sampled, MMP expression is relatively low. (b) Gene expression of all MMPs of different left-ventricular cell types from the single-cell sequencing dataset HeartCellAtlas is plotted as heat map [74]. (c) Since MMP-16 is the only MMP in the GTEx database that has eQTLS in both, LV and coronary artery tissue, this example was selected to show how to obtain and depict information from the GTEx database. Using GTEx data, expression quantitative trait loci (eQTLs) and RNA-seq data are plotted using the integrative genomics viewer (IGV) for the MMP-16 gene coded at chromosome 8 (red arrow). eQTLs, (red dots) are plotted for coronary artery (upper panel) and left ventricular tissue (lower panel) with the p-value (− log10) of eQTLs plotted on the Y-axis. Additionally, RNA-sequencing coverage from an individual sample is plotted for coronary artery (upper panel, light red) and left ventricular tissue (lower panel, purple) as histogram. The collapsed gene model of MMP-16 is depicted below the RNA-sequencing coverage showing exon and intron structure of the gene. Data source: GTEx Analysis Release V8 [39] (dbGaP Accession phs000424.v8.p2) on 19.04.2021 created with GTEx IGV Browser [103, 119]

