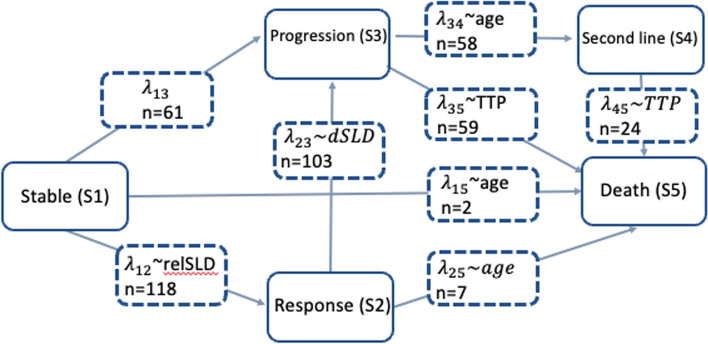
Fig. 3.
A diagram illustrating the multistate model describing the different states and transitions in the patient population studied. λij represents the transition intensities between states, n for the transitions represents the number of observed transitions, n for the states is the number of clinical outcomes at the end of the study. dSLD change in SLD between previous 2 measures, relSLD relative change from baseline, SLD sum of the largest diameter (tumor data); TTP time to progression.
Adapted from Krishnan et al. [13]

