Fig. 1.

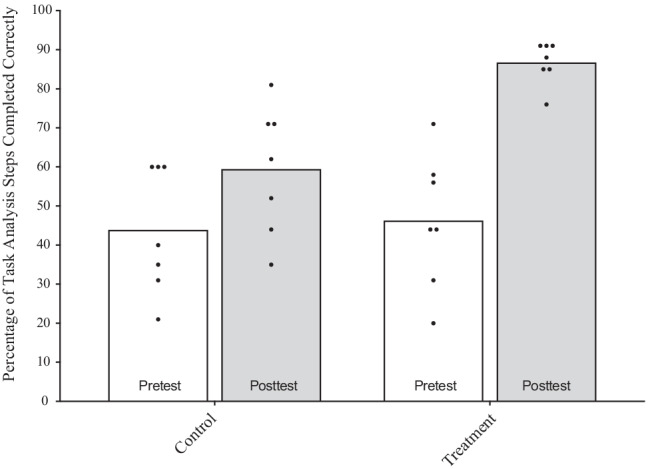
Group and individual performance on pretests and posttests for control and treatment groups Note. The bars represent mean scores for each group, and the data points within each of those bars represents individual scores within that group

Group and individual performance on pretests and posttests for control and treatment groups Note. The bars represent mean scores for each group, and the data points within each of those bars represents individual scores within that group