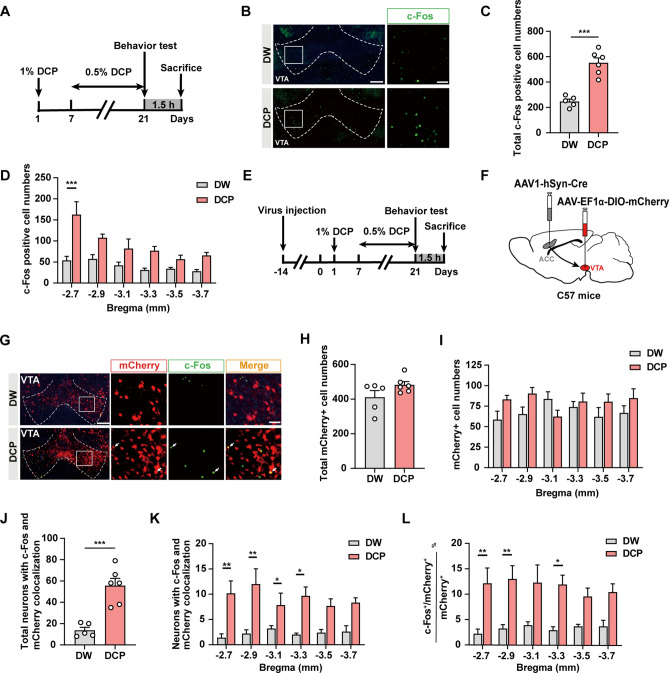
Fig. 4.
VTA neurons are significantly activated during chronic itch. A Timeline of the c-Fos immunostaining experiments. B Representative images of c-Fos expression in the VTA for both DW- and DCP-treated groups. Scale bars, 200 μm (left) and 50 μm (right). C, D Numbers of c-Fos+ neurons in total (C) and different sections (D) of the VTA. n = 5 or 6 mice; ***P <0.001; unpaired Student’s t test for (C); two-way ANOVA followed by Bonferroni post hoc analysis for (D). E Schematic showing the timeline of the immunostaining experiments. F Scheme for specific labeling of ACC-innervated VTA neurons. G Representative images of c-Fos co-staining with mCherry in the VTA. Arrows indicate c-Fos+/mCherry+ neurons. Scale bars, 200 μm (left) and 50 μm (right). H, I Numbers of mCherry+ neurons in total (H) and different parts (I) of the VTA. n = 5 or 6 mice. J, K Numbers of c-Fos+/ mCherry+ neurons in total (J) and different sections (K) of the VTA. n = 5 or 6 mice; *P <0.05, **P <0.01, ***P <0.001; unpaired Student’s t test for (J); two-way ANOVA followed by Bonferroni post hoc analysis for (K). L Percentage of c-Fos+/mCherry+ neurons in mCherry+ neurons for different parts of the VTA. n = 5 or 6 mice; *P <0.05, **P <0.01; two-way ANOVA followed by Bonferroni post hoc analysis. Data are presented as the mean ± SEM.

