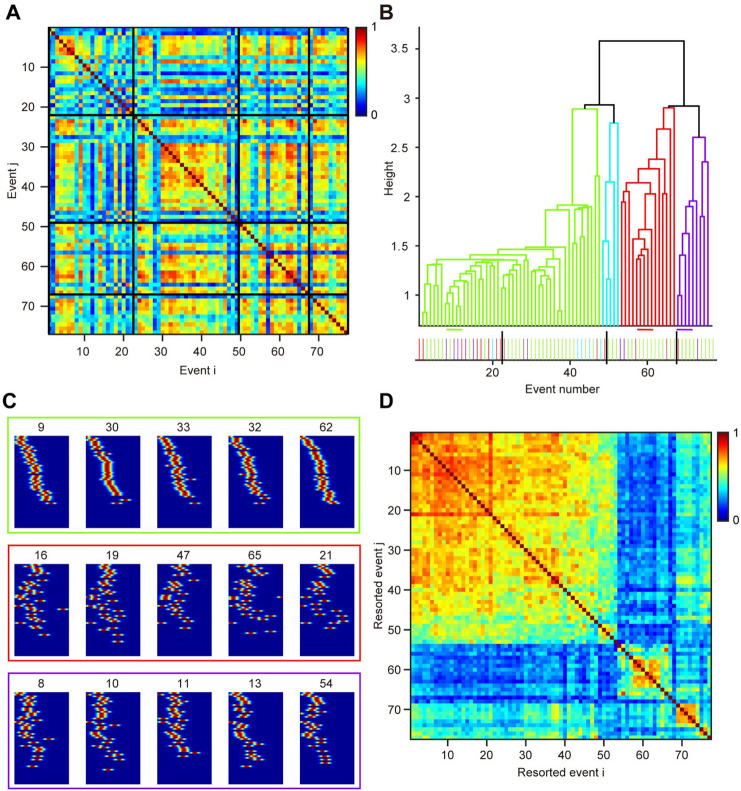
Fig. 2.
Coexistence of multiple spatiotemporal patterns of reverberation events in a network. A SI of all event pairs from four distinct reverberatory episodes (interleaved by black horizontal or vertical lines) of an example network. B Dendrogram plot of the hierarchical binary cluster tree. Each leaf node corresponds to the reordered event number shown in D. The distances between two events are indicated by the height of n-shaped connection lines. Example events from three distinct clusters are indicated by horizontal lines and shown in C. Bottom: events colored by the clustering results are ranked in their temporal order to show that different patterns are mixed temporally. C Three groups of reverberatory spike trains showing patterns I, III, and IV. Neurons were sorted according to the first group and remained unchanged among all events. Values represent their event number in A. D As in A, but event numbers are reordered according to dendrogram results to visualize the cluster blocks.

