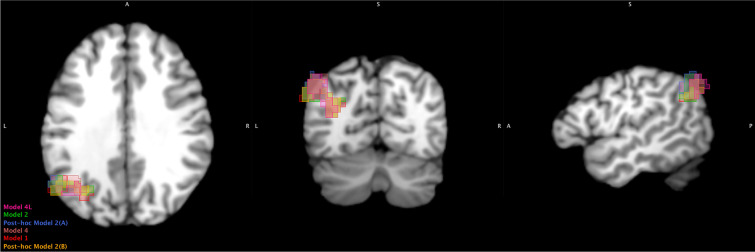
Fig. 4.
Overlay of all clusters (see Table 2) that showed a significant increase (T6-T0) with the Hippocampus. Clusters are from the seed-voxel analysis. Clusters extend outside the brain but this is due to the combination of slightly different coordinates for each cluster being overlayed onto a single image. Created using Multi-image Analysis GUI (MANGO) version 4.1. Left to right = axial, coronal, and sagittal view. Slice coordinates (x, y, z) = -49, -65, 31. A = anterior; L = left; P = posterior; R = right; S = superior

