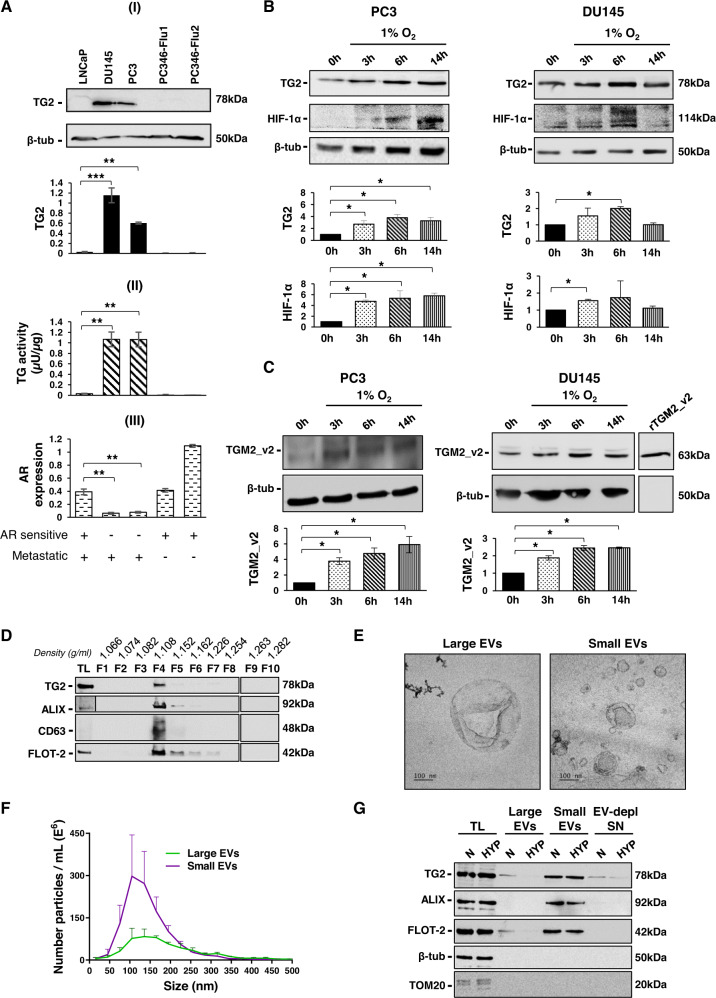
Fig. 1. Characterisation of TG2 in AR-insensitive PCa cell lines and EVs under hypoxic conditions.
A (I) Immunoblot showing expression of TG2 in androgen-sensitive and -insensitive PCa cell lines. Equal protein amounts of total cell lysates were immunoblotted and probed with mouse monoclonal anti-transglutaminase-2 (CUB7402) and rabbit polyclonal anti-β-tubulin as loading control. Densitometry analysis of immunoreactive bands was performed with intensity of band/area normalised to β-tubulin loading control. (II) TG activity was measured in total cell lysates by incorporation of biotinylated cadaverine into fibronectin (FN). Total TG activity is represented in µU/µg. (III) mRNA expression of androgen receptor (AR) using reverse-transcription polymerase chain reaction (RT-PCR) in PCa cell lines with tata-box protein (TBP) as a housekeeping control gene. All quantifications are the mean ± SD of three independent experiments, Student’s t-test: **p ≤ 0.01; ***p ≤ 0.001. B, C Immunoblot of total cell lysates from androgen insensitive metastatic PCa cells, PC3 and DU145 cultured in normoxic (37 °C, 5% CO2) and hypoxic (1% O2) culture conditions, probed using (B) mouse monoclonal anti-TG2 antibody (CUB7402) and mouse monoclonal anti-HIF-1α or (C) rabbit polyclonal anti-TGM2_v2 antibody and rabbit polyclonal anti-β-tubulin as a loading control. A representative blot is shown. Quantifications are the mean ± SD of three independent experiments; data are normalised to β-tubulin and to 0 h, Student’s t-test: *p ≤ 0.05. In (C), expression of a recombinant TGM2_v2 in E. coli served as a positive control. D Western blot analysis of EVs isolated from PC3 serum-free conditioned medium and processed by density gradient ultracentrifugation (Optiprep). The ten collected fractions were analysed for the detection of TG2, ALIX, CD63 and FLOT-2. PC3 WT total cell lysate (TL) was included to verify enrichment of EVs markers. E EVs characterization by Transmission electron microscopy (TEM). EVs were negative stained with uranyl acetate/methylcellulose. F EVs analysis by nanoparticle tracking analysis (NTA). The graph shows average particle concentration according to EVs size. G Western blot analysis of EVs and TCA-precipitated EV-depleted supernatants (EV-depl SN) isolated from PC3 cells under normoxic (N) and hypoxic conditions (HYP) for the detection of EVs markers ALIX, FLOT-2 and EVs negative marker TOM20. TL: PC3 WT total cell lysate.

