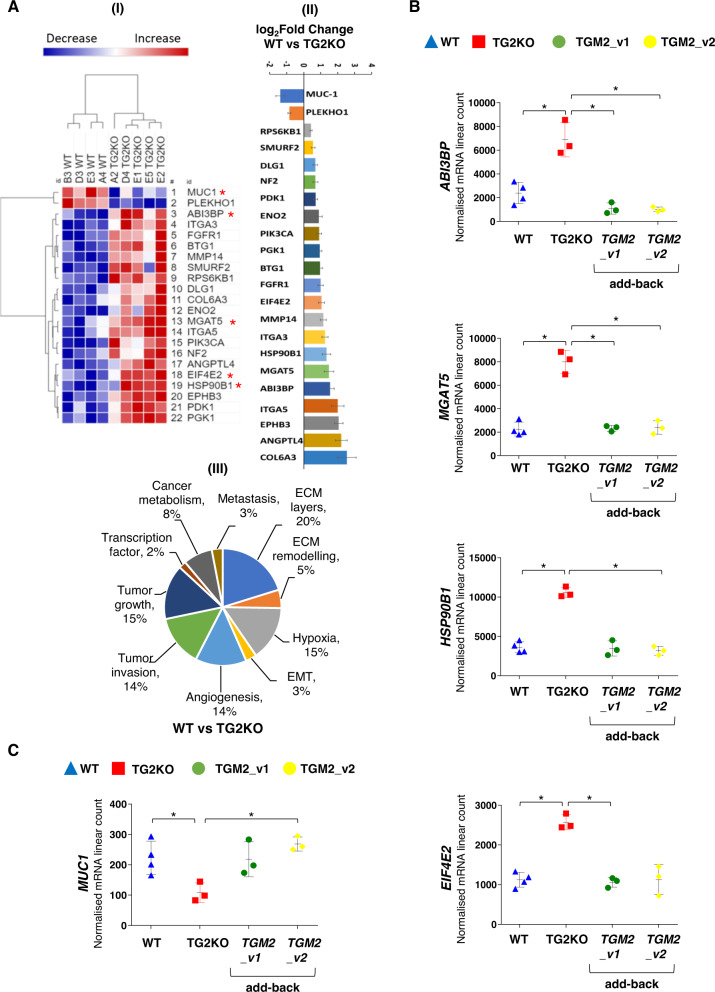
Fig. 3. TG2-dependent expression of cancer-associated genes.
A (I) Normalised mRNA log2 count of each gene modulated either by knockout of TGM2 or add-back of either isoform of TGM2 using NanoString Cancer progression panel, data plotted using Morpheus from Broad Institute https://software.broadinstitute.org/morpheus/. Hierarchical clustering and One minus Pearson Correlation in rows and columns. Intense blue to less intense blue signifies range of gene under expressed, while light red to intense red signifies range of gene over expressed as indicated in the key. Red asterisks indicate genes restored after add-back of TGM2_v1 and/or TGM2_v2. (II) log2 Fold change representation of genes upregulated and downregulated in PC3 TG2KO clones compared to WT PC3 clones. (III) Pie chart categorising the differentially expressed genes into cancer progression categories according to NanoString Cancer progression panel. Each cancer progression category shown with the percentage of gene hit against total number of cancer progression categories. B, C Five genes significantly restored up to WT levels upon add-back of TGM2_v2 and/or TGM2_v1. Scatter plots of normalised mRNA linear count for each differentially expressed gene (mean ± SD). Each symbol represents a clone. Blue triangles represent each WT clone, the red squares represent each TG2KO clone, green circle represents TGM2_v1 add-back clone, yellow circle represents TGM2_v2 add-back clone. Benjamini–Hochberg (BH) multiple correction test: *p ≤ 0.05.

