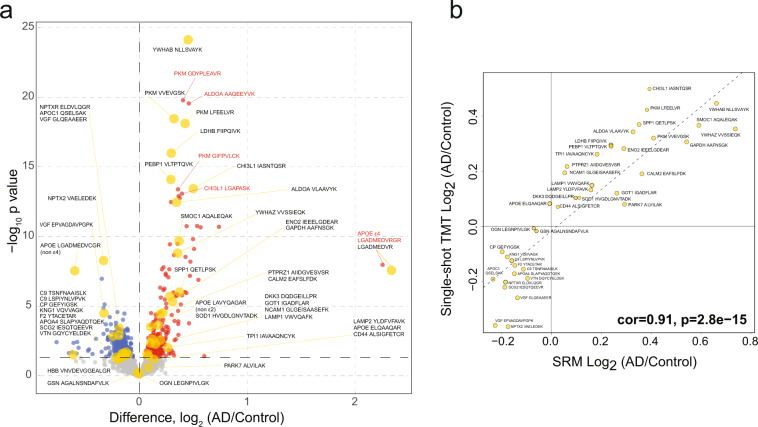
Fig. 5.
Peptide concordance between SRM and ssTMT datasets. (a) Volcano plot displaying the log2 fold change (FC) (x-axis) against t-test log10 p-value (y-axis) for all peptides (n = 2,340) comparing AD (n = 150) versus Controls (n = 147). Cutoffs were determined by significant differential expression (p < 0.05) between control and AD cases. Peptides with significantly decreased levels in AD are shown in blue while peptides with significantly increased levels in disease were indicated in red. 44 of 62 SRM peptides that overlap with this ssTMT dataset and SRM are highlighted as larger yellow points with black text labels. Red text and traces to red points are labels for peptides not included in the current SRM study that were significantly upregulated in the ssTMT dataset. (b) Correlation between the fold-change (AD vs control) of all selected overlapping peptides (n = 40) across SRM (x-axis) and ssTMT (y-axis) were strongly correlated (cor = 0.91, p = 2.8e−15).

