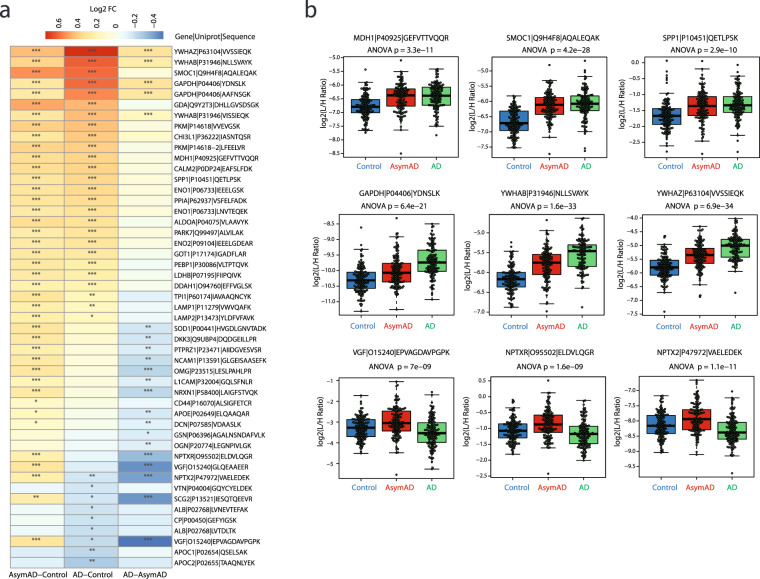
Fig. 7.
Stratifying early from progressive biomarkers of AD. (a) The magnitude of positive (red) and negative (blue) changes are shown on a gradient color scale heatmap representing mean log2-fold change (Log2 FC) for each of 49 peptides significant in any of the 3 group comparisons. Tukey significance of the pairwise comparisons is indicated by overlain asterisks; *p < 0.05, **p < 0.01, ***p < 0.001. (b) Peptide abundance levels of selected panel markers that are differentially expressed between groups. The upper row highlights biomarkers that are significantly different in AsymAD versus controls, but not significantly different in AsymAD versus AD. The middle row of 3 peptides highlights progressive biomarkers of AD, which show a stepwise increase in abundance from control to AsymAD to AD cases. The bottom row highlights a set of proteins that are increased in AsymAD compared to controls but decreased in AD versus control or AsymAD samples.

