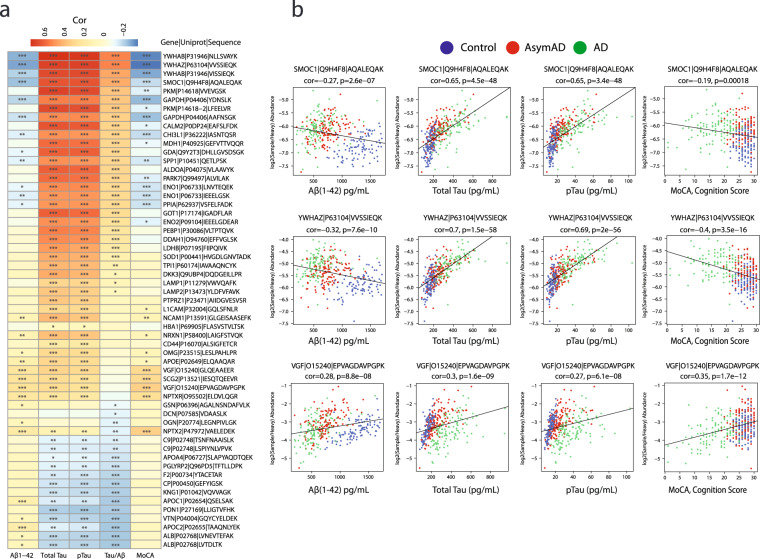
Fig. 8.
Correlating CSF peptide biomarker abundances to amyloid, Tau, and cognitive measures. (a) Positive (red) and negative (blue) Pearson correlations between biomarker peptide abundance and immunoassay measures of Aβ(1–42), total Tau, phospho-T181 Tau (pTau), ratio of total Tau/Aβ, and cognition (MoCA score). Student’s t test significance is indicated by overlain asterisks; *p < 0.05, **p < 0.01, ***p < 0.001. (b) Individual correlation scatterplots are shown for SMOC1 (upper row), YWHAZ (middle row), and VGF (lower row). Individual cases are colored by their diagnosis; blue for controls, red for AsymAD cases, and green for AD cases. Amyloid immunoassay measures of 1,700 (maximum, saturated value in the assay) were not considered for correlation. Pearson correlations (rho), Student p values of correlation significance, and numbers of paired observations for correlation of biomarker peptide abundances to immunoassay measures of Aβ(1–42), total Tau, phospho-T181 Tau, and the ratio of total Tau/ Aβ are in the ELISA_PearsonCors file in the Data folder on Synapse25.

