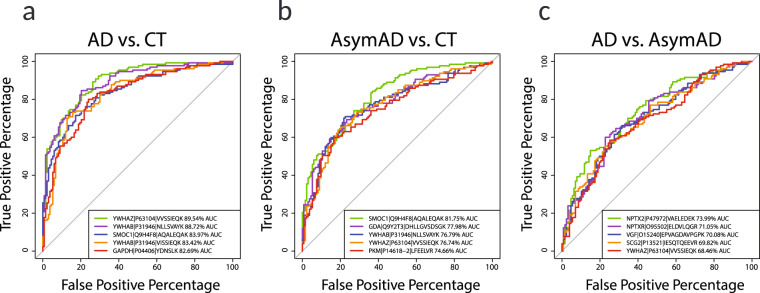
Fig. 9.
Receiver-operating characteristic (ROC) curve analysis of peptide diagnostic potential. ROC curves for each of three pairs of diagnosed case groups were generated to determine the top-ranked diagnostic biomarker peptides among the 58-peptide panel plus 4 APOE specific peptides. (a) A total of 263 AD (N = 130) and control (N = 133) CSF case samples were classified according to the logistic fit for each peptide’s log2(ratio) measurements across these samples, and the top 5 ranked by AUC are shown. (b) Top five performing peptides for discerning AsymAD (N = 127) from control (N = 133) case diagnosis groups are provided with AUCs, nominating these peptides as potential markers of pre-symptomatic disease, and as cognates for AT+ biomarker positivity. (d) Symptomatic AD (N = 130) and AsymAD (N = 127) discerning peptides were ranked by AUC and the top five ROC curves are shown and nominated as cognate CSF measures for compromised patient cognition. ROC curve statistics including AUC, p, 95% DeLong confidence interval, accuracy, specificity, and sensitivity for dichotomous diagnosis case sample groups are in the ROCstatistics file in the Data folder on Synapse25.

