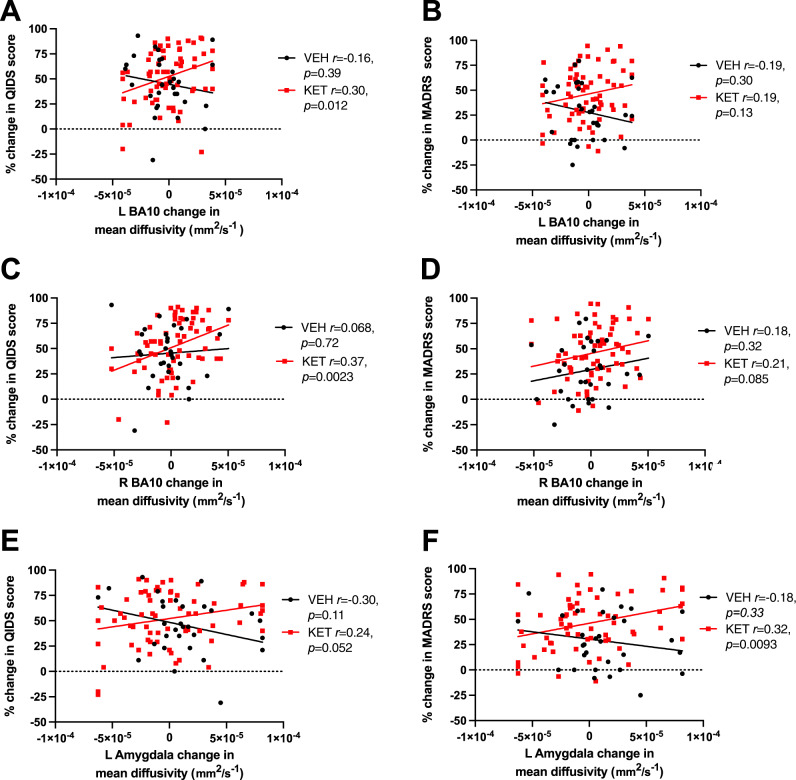
Fig. 1. Associations between change in depression and change in mean diffusivity as a function of treatment.
Within-group correlations between change in QIDS-SR (A, C, E) or MADRS (B, D, F) scores and the change in mean diffusivity for select brain regions. Post hoc Pearson r and p values shown separately for the vehicle (n = 31) and ketamine (n = 67) groups; see main text and Table 2 for full omnibus regression statistics. A positive change in depression score indicates an improvement in depression on that scale, and a positive change in MD indicates decreased diffusion in that region (interpreted as increased plasticity).

