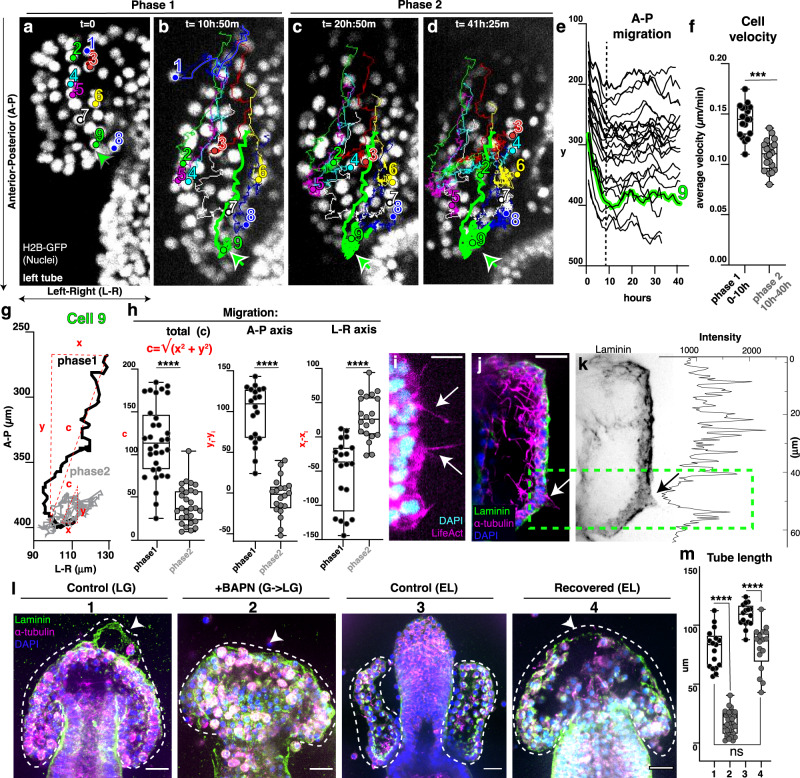
Fig. 2. Tube extension and expansion involve active cell migration.
a–d Time lapse images of the tubes expressing H2B-GFP to track movements of single nuclei (Supplementary Movie 6). Tracked cells are labeled with unique colors/numbers to visualize trajectories. In 2D projections, cell movements are recorded along the A-P axis (advancing direction) and the L-R axis. Note that in A and B, cell 1 has undergone an epithelial to mesenchymal transition (EMT) and migrates into the blastocoel, away from the elongating tube. e Cell migration along the A-P axis of the embryo (the y axis of the movie) over time. Cell 9 from is highlighted in green to show the two phases of migration. Graph includes cell trajectories of both tubes for 2 independent movies, (Supplementary Movie 5–8; n = 30 cells). f Average cell velocity for phase 1 and 2 for 2 independent movies. n = 19 (phase 1) and 20 (phase 2); ***p = 0.0008. g The trajectory of Cell 9 exemplifies cell movement along A-P and L-R axes. c represents the total cell displacement and is calculated as shown. h Maximum cell displacement happens in phase 1 and occurs along the A-P axis. In phase 2, cell displacement happens along the L-R axis. Track data for n = 50 cells from two independent movies. i Image from Supplementary Movie 9 showing actin-rich filopodia from tube cells (arrows), sb = 10 μm. j, k Cell protrusion marked by tubulin extend out from a gap in the basal lamina (arrows and green dotted box); sb = 10 μm. Graph indicates intensity of laminin antibody staining to highlight that where the cell protrusion extends out there is a drop in laminin signal intensity. l Pharmacological approach to block ECM remodeling inhibits tube extension; sb = 20 μm. m Tube length quantification in BAPN treatments. n = number of larvae is 17 (1); 34 (2); 16 (3); 17 (4). For all graphs, statistical significance was assessed by a two- sided Student’s t-test (****p < 0.0001; ns not significant). In box plots the median is the middle line, box represents 25th and 75th percentiles, whiskers indicate the minimum and maximum data range. Data are presented as mean values +/− SEM. Source data are provided as a Source Data file.

