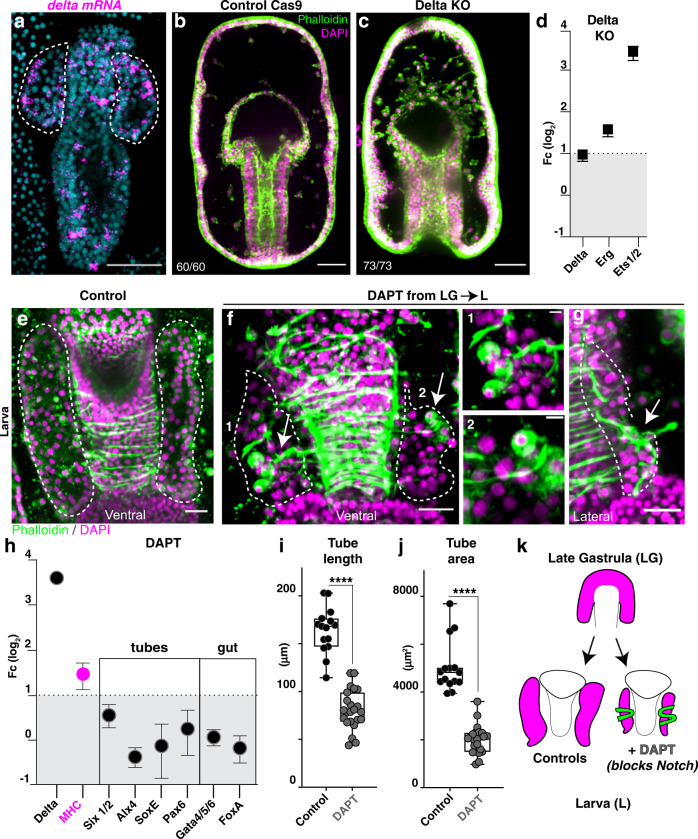
Fig. 4. Delta-Notch signaling represses a muscle phenotype in the tubes.
a Fluorescent in situ hybridization (FISH) shows Delta gene expression in scattered cells of the gut and the tubes (highlighted by dotted lines). b, c Delta knock out embryos fail to form the epithelial tubes that instead become excess mesenchymal cells. Penetrance of the Delta KO phenotype was 100% and all embryos died at the late gastrula stage; for genomic mutation see Supplementary Fig.12. d qPCR showing increase of mesodermal markers Erg, Ets1/2 and Pax6 in delta KO embryos. Bars represent mean with standard error of the mean (SEM). e–g Larvae stained with phalloidin to mark muscles; Delta-Notch inhibition leads to smaller tubes constricted by muscle fibers that wrap around the tubes (arrows indicate muscles, magnification in inserts 1 and 2) and the foreguts. Arrows in g show that tube cells become muscle-like. Note that the control tubes are as long as the esophagus, while in treated embryos the tubes are shorter than the esophagus. h The increase in muscle-like cells is also reflected by increase in expression of the muscle marker MHC, while other known marker genes for tubes and the digestive system do not change. Bars represent mean with standard error of the mean (SEM). n = 3 biologically independent experiments. i, j Tubes are significantly smaller in DAPT treated than control embryos. Control: n = 15 larvae; DAPT treated n = 23 larvae. k Cartoon summarizing the result of Notch inhibition. All experiments are representative of 3 biological replicates. a, b, c, f, g scale bar = 50 μm. h scale bar is 10 μm. Statistical significance was assessed by a two- sided Student’s t-test (****p < 0.0001). In box plots the median is the middle line, box represents 25th and 75th percentiles, whiskers indicate the minimum and maximum data range. Source data are provided as a Source Data file.

