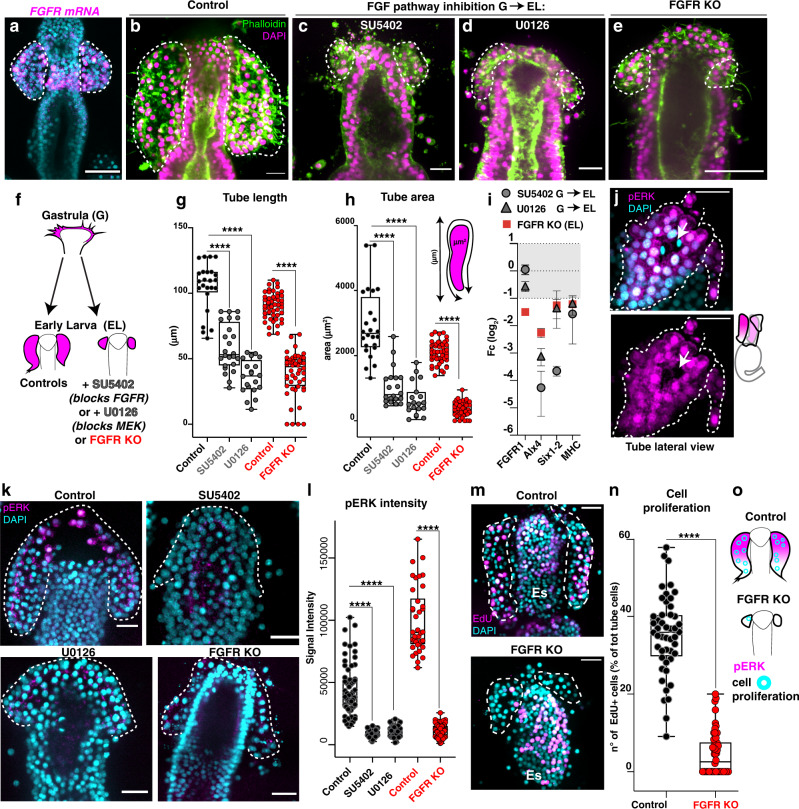
Fig. 6. FGF signaling promotes tube outgrowth through pERK.
a FISH of FGFR shows expression in scattered cells. b Control and early larva treated with the FGFR inhibitor SU5402 (30μM) (c) or with the MEK inhibitor U0126 (10μm) (d) from the end of gastrulation to early larvae (G→EL). e Early larvae in which the FGFR is knocked out by Cas9 lack the tubes. Percentage of the FGFR KO larvae showing the phenotype was 96%; for genomic mutation see Supplementary Fig.14. f Cartoon summarizing FGFR inhibition phenotypes. g, h Tube length and area are significantly decreased in larvae where the FGF pathway was blocked. n = number of tubes (controls = 26, SU5402 = 26; U0126 = 20, CAS9 control = 48; FGFR KO = 50). i qPCR of significant genes in larvae where tube outgrowth was prevented. Bars represent mean with standard error of the mean (SEM). n = 3 biologically independent experiments. j Immunofluorescence showing that active ERK is localized in the nuclei of most tube cells. Arrows indicate dividing cells without pERK staining. k pERK staining is absent when FGF signaling is blocked. l Signal intensity of pERK in the above experiments. The Y axis in the graph shows the raw integrated intensity for pERK normalized by the background signal for each image. m EdU staining to mark proliferating cells and signal quantification (n). Since the tubes of the FGFR KO larvae had fewer cells than controls, we assessed proliferation rate by counting the EdU+ cells normalized to the total number of tube cells; n = 48 larvae (controls), n = 50 larvae (FGFR KO). o Schematic showing that inhibition of the FGF pathway at different levels prevents tube growth and pERK activation. White dotted lines outline the tubes. Es esophagus. Scale bar = 50 μm (a, e); scale bar = 20 μm (b–d, j, k, m). Statistical significance was assessed by a two- sided Student’s t-test (****p < 0.0001; ns not significant). In box plots the median is the middle line, box represents 25th and 75th percentiles, whiskers indicate the minimum and maximum data range. Source data are provided as a Source Data file.

