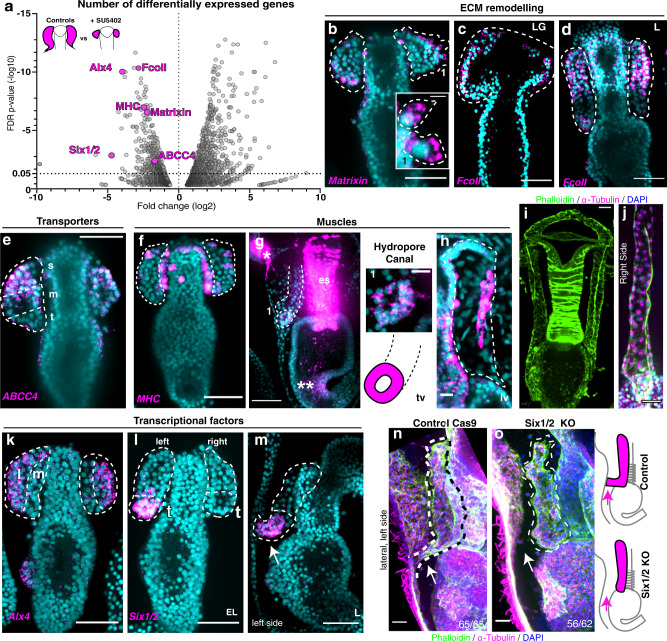
Fig. 7. Differential RNA-seq reveals genes responsive to FGF signaling.
a Volcano plot of differentially expressed genes between controls and larvae where FGFR was blocked. Using the Wald test, p-values, false discovery rate (FDR) and fold changes were generated. Gene/Transcripts with p value < 0.05 were called as differentially expressed genes/transcripts for the comparison. b, c FISH for genes involved in extracellular matrix (ECM) remodeling, matrixin (b), and Fcoll (c, d). Insert 1 in (b) shows matrixin transcripts in cells extending protrusions. e FISH for the transporter ABCC4 shows expression in tube stalk cells. f–h FISH showing myosin heavy chain (MHC) gene expression in the hydropore canal (1), the pyloric sphincter (** in g), the tube longitudinal muscle (h), the dorsal muscles (* in g) and the esophageal muscles (es in g). i, j Longitudinal muscles are localized on the tube ventral side. k–m FISH for Alx4 and Six1/2. Six1/2 is expressed at the tip of the left tube and later in the hydropore canal (arrow in m). n, o Six1/2 KO did not form the hydropore canal (arrow). Percentage of the Six1/2 KO phenotype was 90%; for genomic mutation see Supplementary Fig.15. All images are maximum projections of confocal z-stacks. All experiments were independently repeated at least 3 times with similar results. FDR false discovery rate, s stalk, m medial, t tip, tv transverse view, lv lateral view. scale bar = 50 μm (b–g, k–o); scale bar = 20 μm (i, j); scale bar = 10 μm (h). Source data are provided as a Source Data file.

