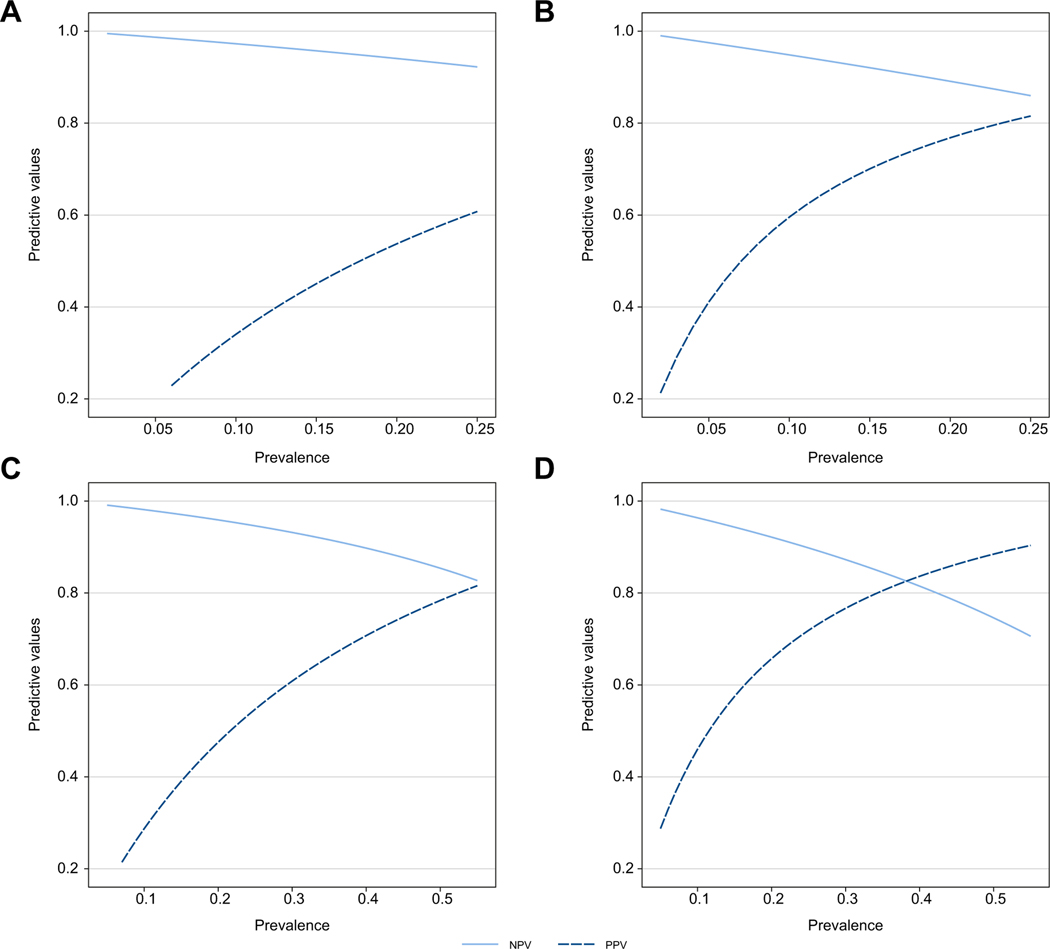
Fig. 5. Sensitivity analysis assessing the impact of disease prevalence on PPV and NPV.
For Agile 4, the prevalence of cirrhosis was varied from 0.02 to 0.25 for (A) the cut-off of 0.251 (sensitivity = 0.79, specificity = 0.83) and (B) the cut-off of 0.565 (sensitivity = 0.53, specificity = 0.96) to evaluate their impact on NPV and PPV. For Agile 3+, the prevalence of advanced fibrosis was varied from 0.05 to 0.55 for (C) the cut-off of 0.451 (sensitivity = 0.87, specificity = 0.76) and (D) the cut-off of 0.679 (sensitivity = 0.69, specificity = 0.91). NPV, negative predictive value; PPV, positive predictive value.

