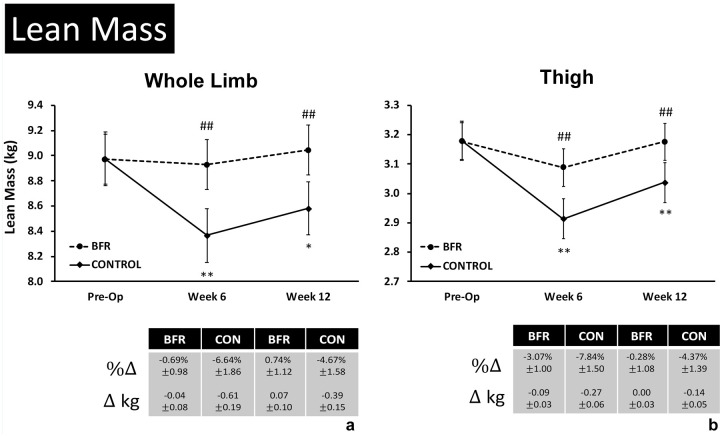
Figure 5.
Changes in lower extremity lean mass after 6 and 12 weeks of rehabilitation.
Data are presented as adjusted mean ± 95% CI for lean mass measures in the injured limb before surgery (Pre-Op) and after 6 and 12 weeks of rehabilitation for (a) whole limb lean mass and (b) thigh lean mass (kg, templated to distal 2/3 of the thigh for each patient). *, **Significant change from Pre-Op baseline within group at P < 0.05 and P < 0.01, respectively; #,##Significant difference between groups at the same measurement timepoint at P < 0.05 and P < 0.01, respectively. BFR, blood flow restriction therapy; CON, CONTROL.

