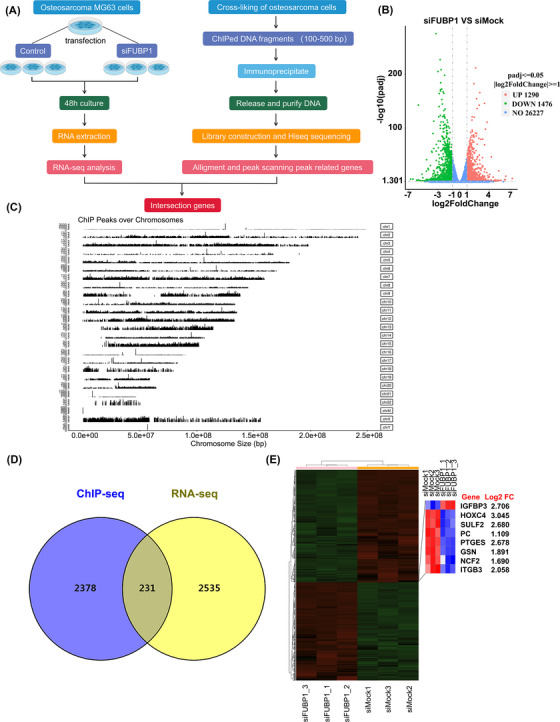
FIGURE 4.

The key downstream genes of far upstream element‐binding protein 1 (FUBP1) were enriched using chromatin immunoprecipitation (ChIP)‐seq and RNA‐seq. (A) ChIP‐seq enrichment and RNA‐seq analysis workflow. (B) RNA‐seq analysis of the differentially expressed mRNAs between FUBP1‐knockdown and Ctrl‐treated MG63 osteosarcoma cells. The red dots represent upregulation, the green dots represent downregulation, and the blue dots represent genes whose fold change was less than twofold. A total of 28,993 genes were identified, including 1290 upregulated genes and 1476 downregulated genes (|log2 fold change| > 1, p < 0.05). (C) ChIP‐seq demonstrated the ChIP peaks over chromosomes using the FUBP1 antibody. (D) Venn diagram comparing the differentially expressed genes identified by RNA‐seq and those identified by ChIP‐seq. (E) A heatmap showing the mRNA expression levels of candidate genes in FUBP1 knockdown or Ctrl‐treated MG63 osteosarcoma cells.
