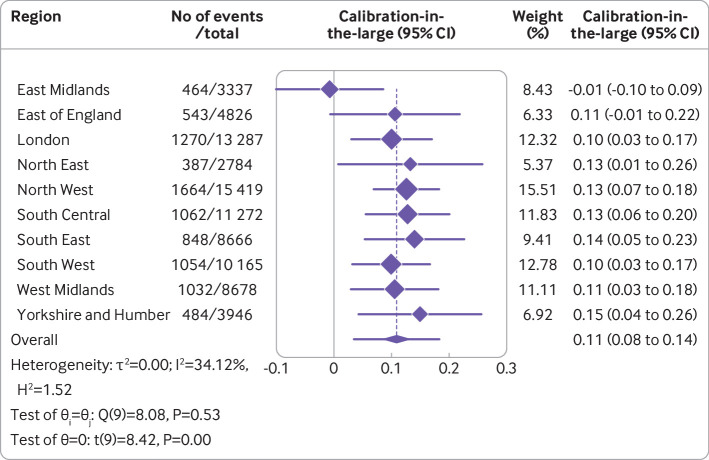
Fig 5.
Results from internal-external cross validation of Cox proportional hazards model for calibration-in-the-large. Plots display region level performance metric estimates and 95% confidence intervals (diamonds with lines), and an overall pooled estimate obtained using random effects meta-analysis and 95% confidence interval (lowest diamond) and 95% prediction interval (line through lowest diamond). CI=confidence interval

