Fig 8.

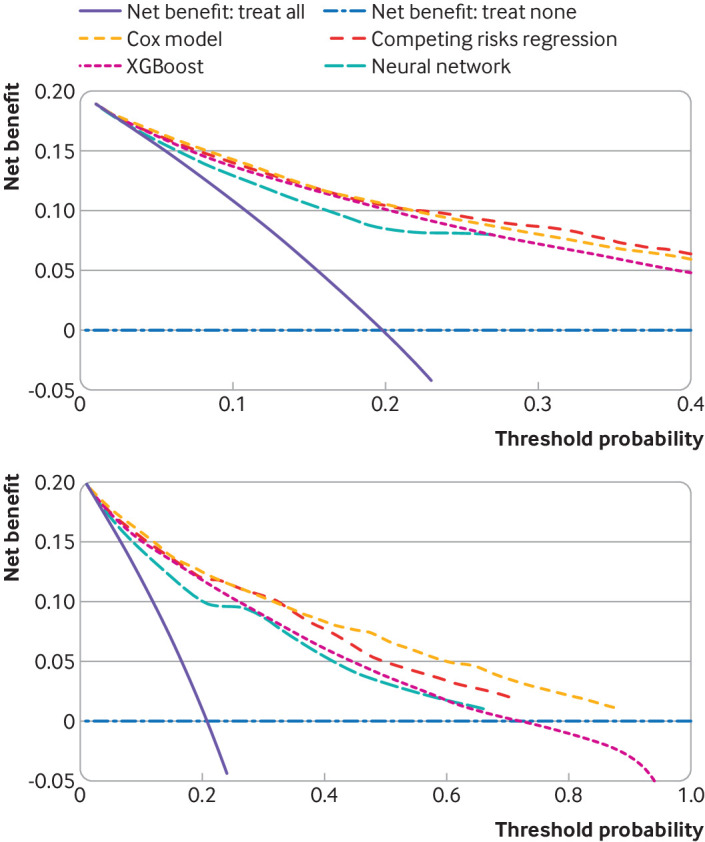
Decision curves to assess clinical utility (net benefit) of using each model. Top plot accounts for the competing risk of other cause mortality. Bottom plot does not account for competing risks

Decision curves to assess clinical utility (net benefit) of using each model. Top plot accounts for the competing risk of other cause mortality. Bottom plot does not account for competing risks