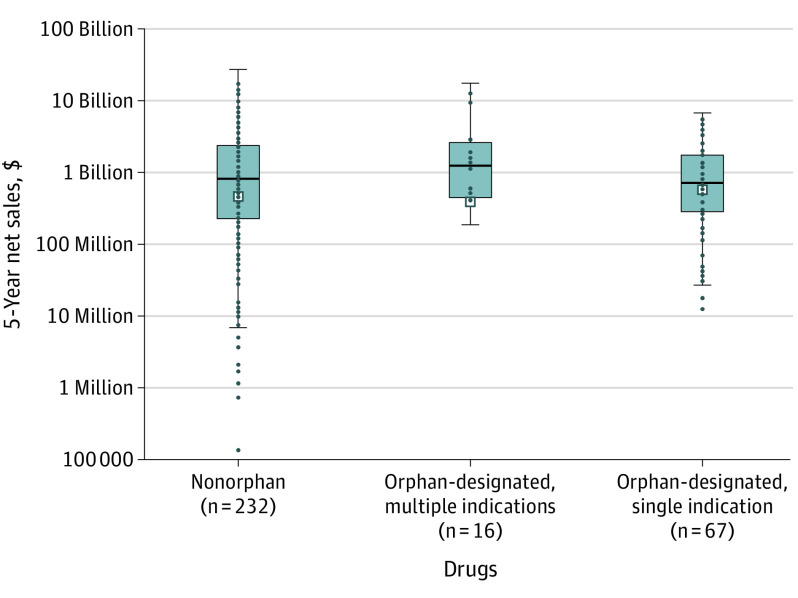
Figure. Five-Year Net Sales, Stratified by Orphan Drug Designation.
Box-and-whisker plot for the first 5-year net sales after drug launch of drugs marketed between 2008 and 2016. Net sales are in 2021 US dollars and are shown on a logarithmic scale. Boxes represent the 25th to 75th percentiles; horizontal lines, medians; Xs, means. Whiskers extend to 1.5 times the IQR; each dot represents an individual drug’s net sales. Drugs were stratified by whether they were initially approved for orphan-designated or nonorphan indications. Orphan-designated drugs were further stratified by whether they had multiple indications during the first 5 years after marketing, including multiple orphan-designated indications (n = 10) or the addition of at least 1 nonorphan indication (n = 6). Not shown are 4 drugs with no reported sales (3 nonorphan and 1 orphan-designated with multiple indications).

